v1.14.0 Release
· 2 min read
Features
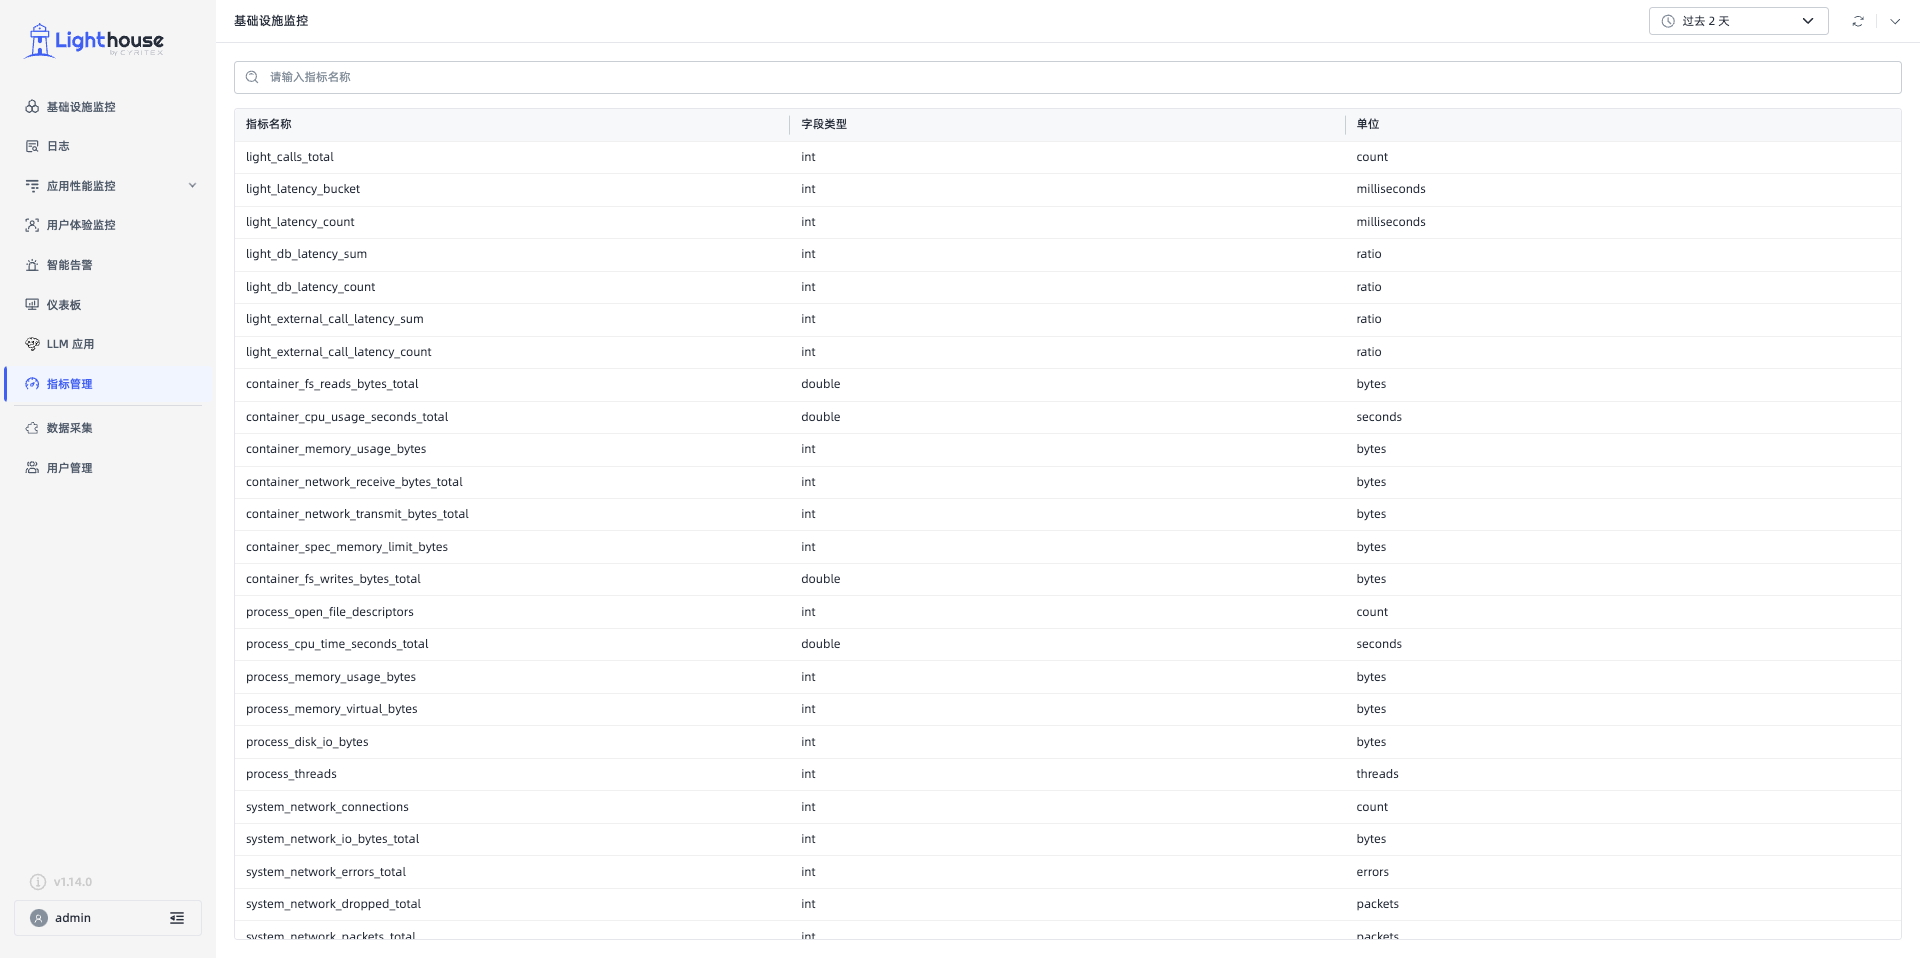
- Metrics Management: Added "Metrics Management" module to display all collected metric data. Currently supports metrics from the infrastructure monitoring module.
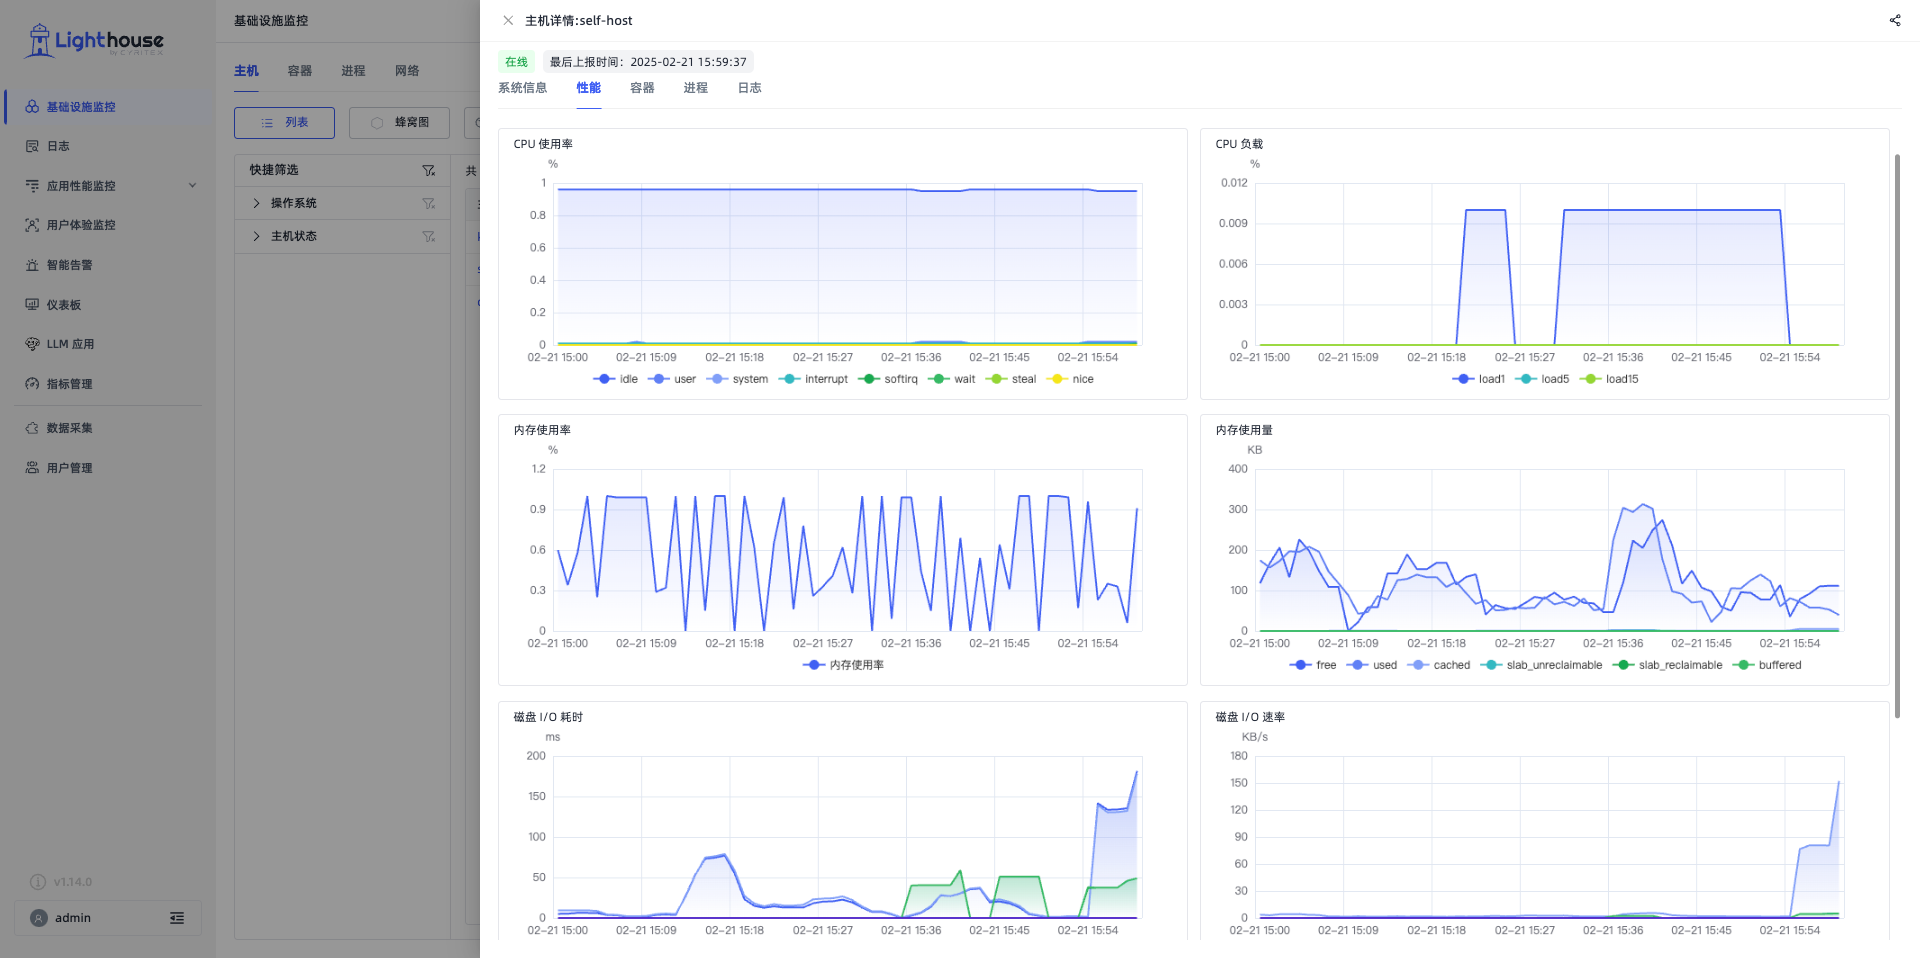
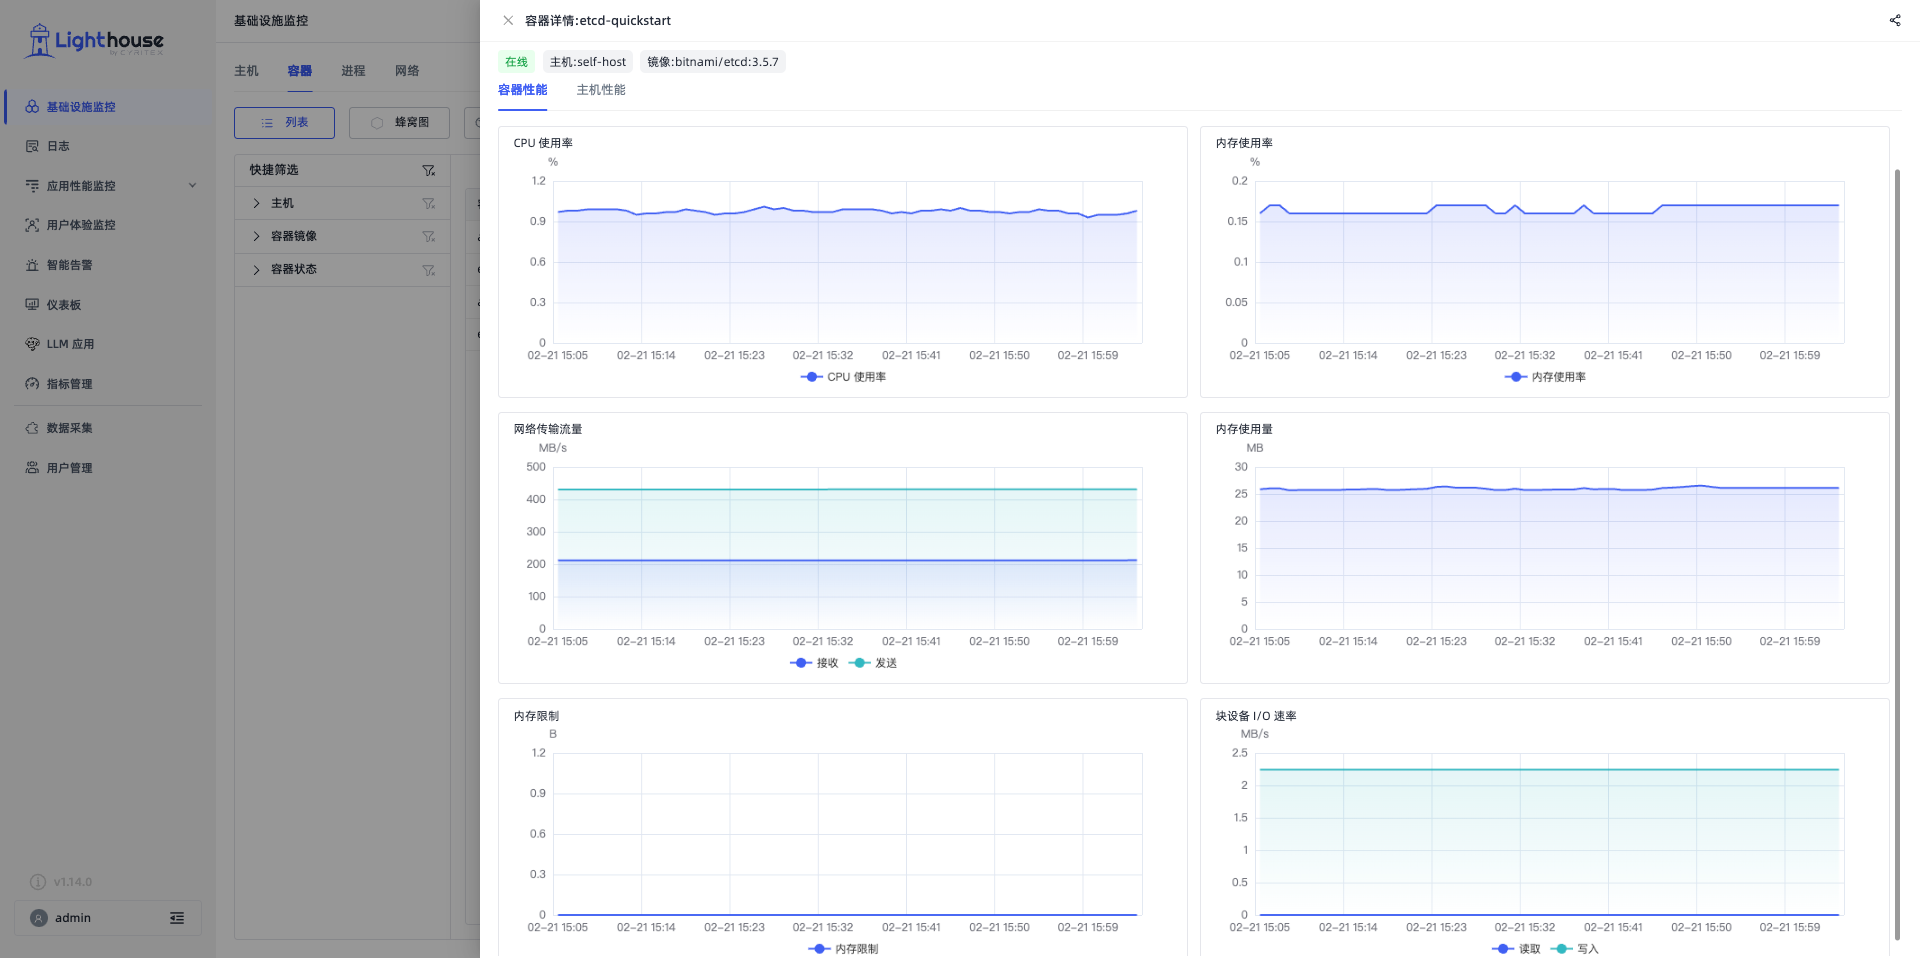
- ITIM: Added performance trend charts to host, container, and process detail pages for intuitive performance monitoring. Container and process detail pages also show performance metrics of associated hosts.
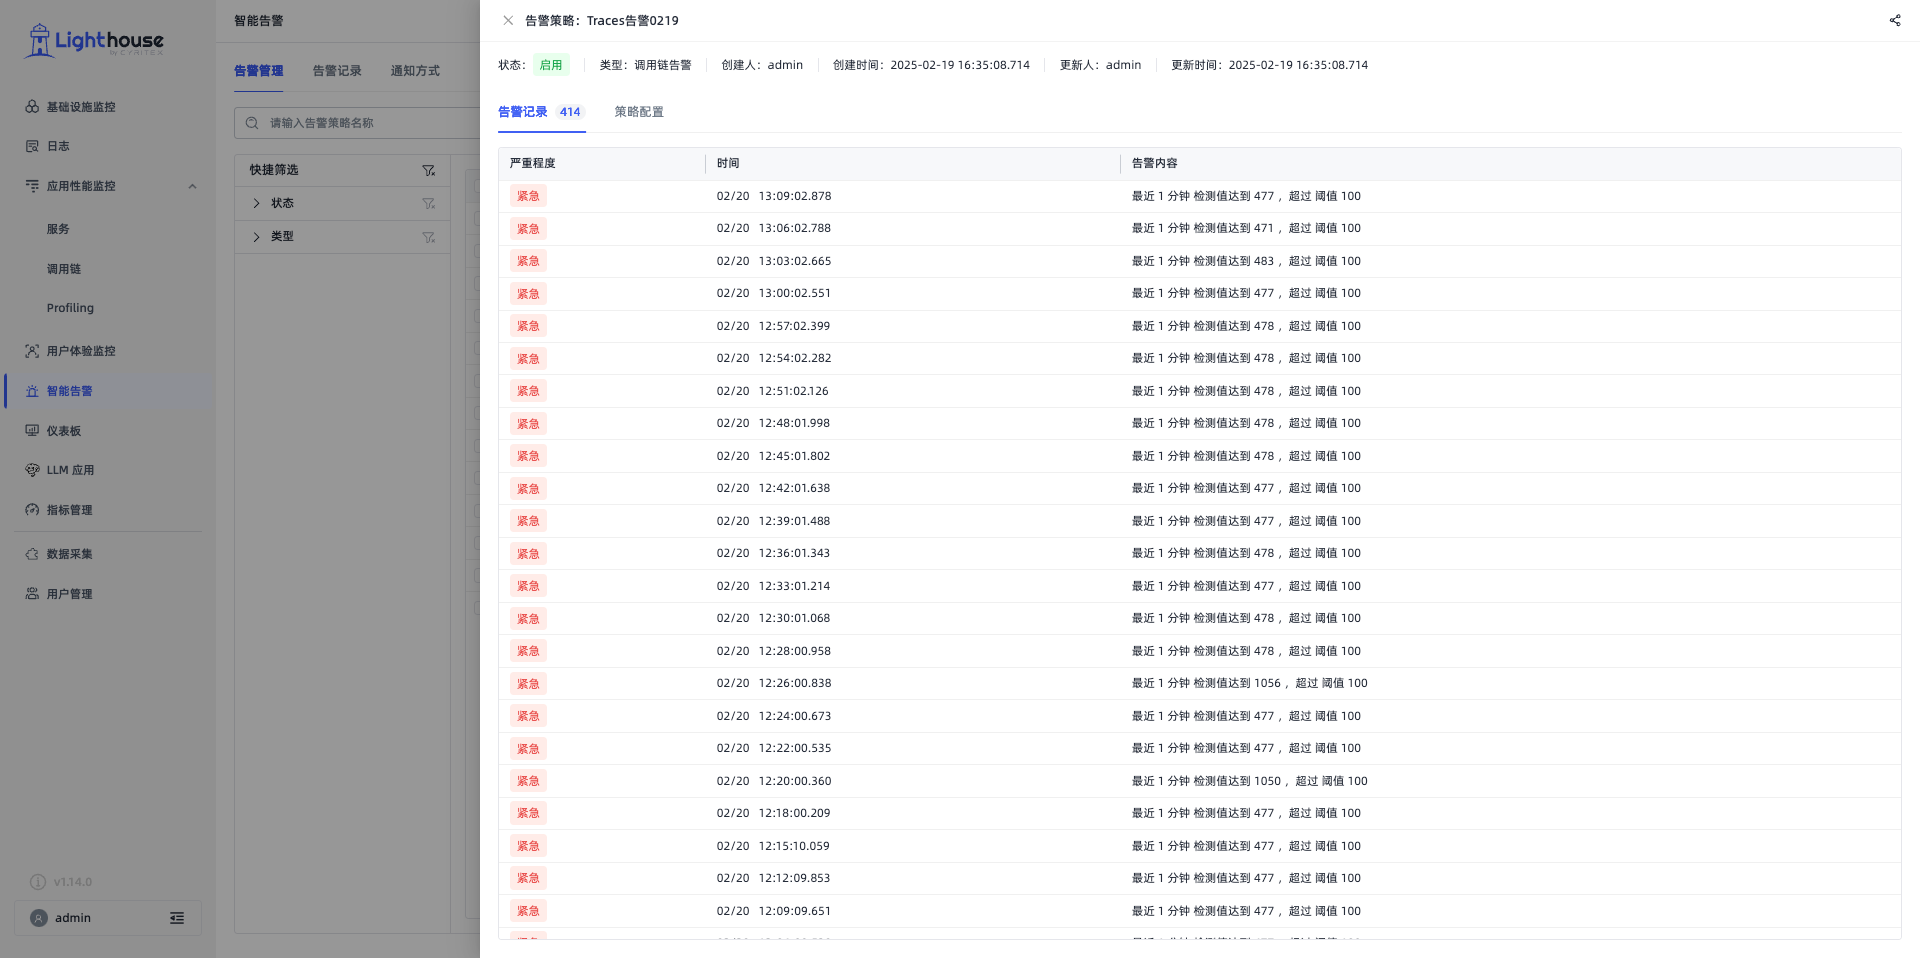
- Alert: Added alert policy detail page to display policy attributes, alert records, and latest configuration information.
 |  |
|---|---|
 |  |
Improvements
- ITIM: To reduce data storage and query pressure and better align with high-frequency usage scenarios, host, container, and process list data can now directly query up to 48 hours of historical data.
Bug Fixes
- Fixed an issue where related data jumps would occasionally result in errors.
- Fixed an issue with the LLM top search being abnormal.
- Fixed an issue where clicking on Top 10 traces in LLM would cause an error.
- Fixed an issue where clicking on "View Session Details" in LLM would not navigate to the details page.
- Fixed an issue where the waterfall chart in the LLM Trace Details was not aligned.
- Fixed issues with dragging, zooming in, and zooming out the ITIM honeycomb chart when the number of elements was high.
- Fixed an issue with the Profiling list displaying bandwidth incorrectly.
- Fixed an issue with the units displayed for numbers in the Profiling list.
- Fixed an issue where the Profiling details page would occasionally throw an error.
- Fixed an issue where the time component was missing in the upper right corner of the alarm record.