9 posts tagged with "Dashboard"

Some new dashboard features

View all tags

v1.19.0 版本发布

· 3 min read

重大更新(Breaking Changes)

重大更新

Lighthouse 的「LLM 应用」模块,正式推出「人工评估」、「Prompt 管理」两大功能。

  • 人工评估

不同的 LLM 应用 ,有不同的业务目标,企业通常根据 LLM 应用的 input 和 output 内容来判断模型输出效果是否符合预期。Lighthouse 的人工评估功能,可以自定义评估维度(如准确性、简洁性、安全性等),并对每条 Trace、Span 数据进行多维度评分。帮助开发团队深入了解模型表现、识别问题、并持续优化模型质量,确保企业推出真正符合业务目标的优质 LLM 应用。

  • Prompt 管理

在开发 LLM 应用时,提示词版本混乱、缺乏效果追踪、缺少数据回溯、团队协作困难等问题,会拉低调试 Prompt 的工作效率。Lighthouse 的 Prompt 管理功能,提供 Prompt 的集中式存储库,可以对 Prompt 进行版本控制、数据对比、高效维护,显著提升 LLM 应用的质量及开发效率。
v1.18.0 版本发布

· 4 min read

新增特性(Feature)

  1. 管理:
    1. 新增「License 管理」模块:对不同模块核心资源量的使用进行管控和统计。

      注意:从1.17.0及之前的版本,直接升级到 1.18.0及以上版本,需要提前手动清空所有数据才可正常使用。如遇此情况,请联系技术支持。

    2. 新增「数据上报地址」模块:可以统一修改平台多个模块的数据配置信息,用于解决自动识别的数据上报地址与实际不符的情况。
  2. 仪表板:
    1. 数字概览图表,可以配置映射规则,对查询值赋值、并配色。
    2. 折线图、柱形图图表,可以配置阈值标记、并配色。
    3. 仪表板列表支持批量导出 JSON。
  3. LLM:
    1. 「会话分析」新增「Spans 列表」页面:展示每条 Span 的基本信息与性能数据,单击即可查看详情信息。
    2. 「会话分析」的 Traces 和 Spans 列表页,增加快捷筛选,可以根据类型、名称、使用模型、状态快速筛选出目标数据。

v1.17.0 版本发布

· 4 min read

新增特性(Feature)

  1. APM:
    1. 新增「自定义业务接口聚合规则」:可以将多个接口调用识别为同一个接口,有效地帮助客户从技术视角切换到业务功能视角,去观测接口的性能问题。
  2. LLM:
    1. 新增「拓扑」模块: 为 LLM 应用提供了一个全面且直观的调用关系、性能状况全景图。通过展示所有 Span 节点之间的调用关系及聚合后的性能指标,能够快速洞察 LLM 应用的整体运行状况、聚焦问题节点,精准定位问题,从而实现高效优化与管理。

v1.16.0 Release

· 2 min read

Features

  • Dashboard:
    • Support querying LLM data and creating various custom charts.
    • Added view variables to enable switching variable values in dashboards, which can be applied in real-time to multiple charts. This helps users customize quick filtering and data analysis.
    • Support for PromQL query statements.
    • Added new chart type: Leaderboard.

v1.15.0 Release

· 2 min read

Features

  • Logs: Support full-text and fuzzy search for log messages. Searched content will be highlighted in blue within the log list or hover tooltips.
  • Dashboard:
    • New chart types: Number Overview, Pie Chart, and Text.
    • When selecting metrics, field names and metric descriptions are displayed simultaneously to help users quickly select desired data metrics.
    • Automatically matches appropriate units after metric selection. When users manually modify units, appropriate data conversion is performed.
    • Support for custom fill colors.
  • RUM: Quick filtering and search capabilities for performance event information in the View details page.
  • Alerts: Alert policy details page now includes statistics and filtering capabilities for different severity levels of alert records.
  • Added settings buttons to Dashboard, RUM, and LLM applications for quick access to settings pages.

v1.12.0 Release Notes

· 3 min read

Breaking Changes

Breaking Changes

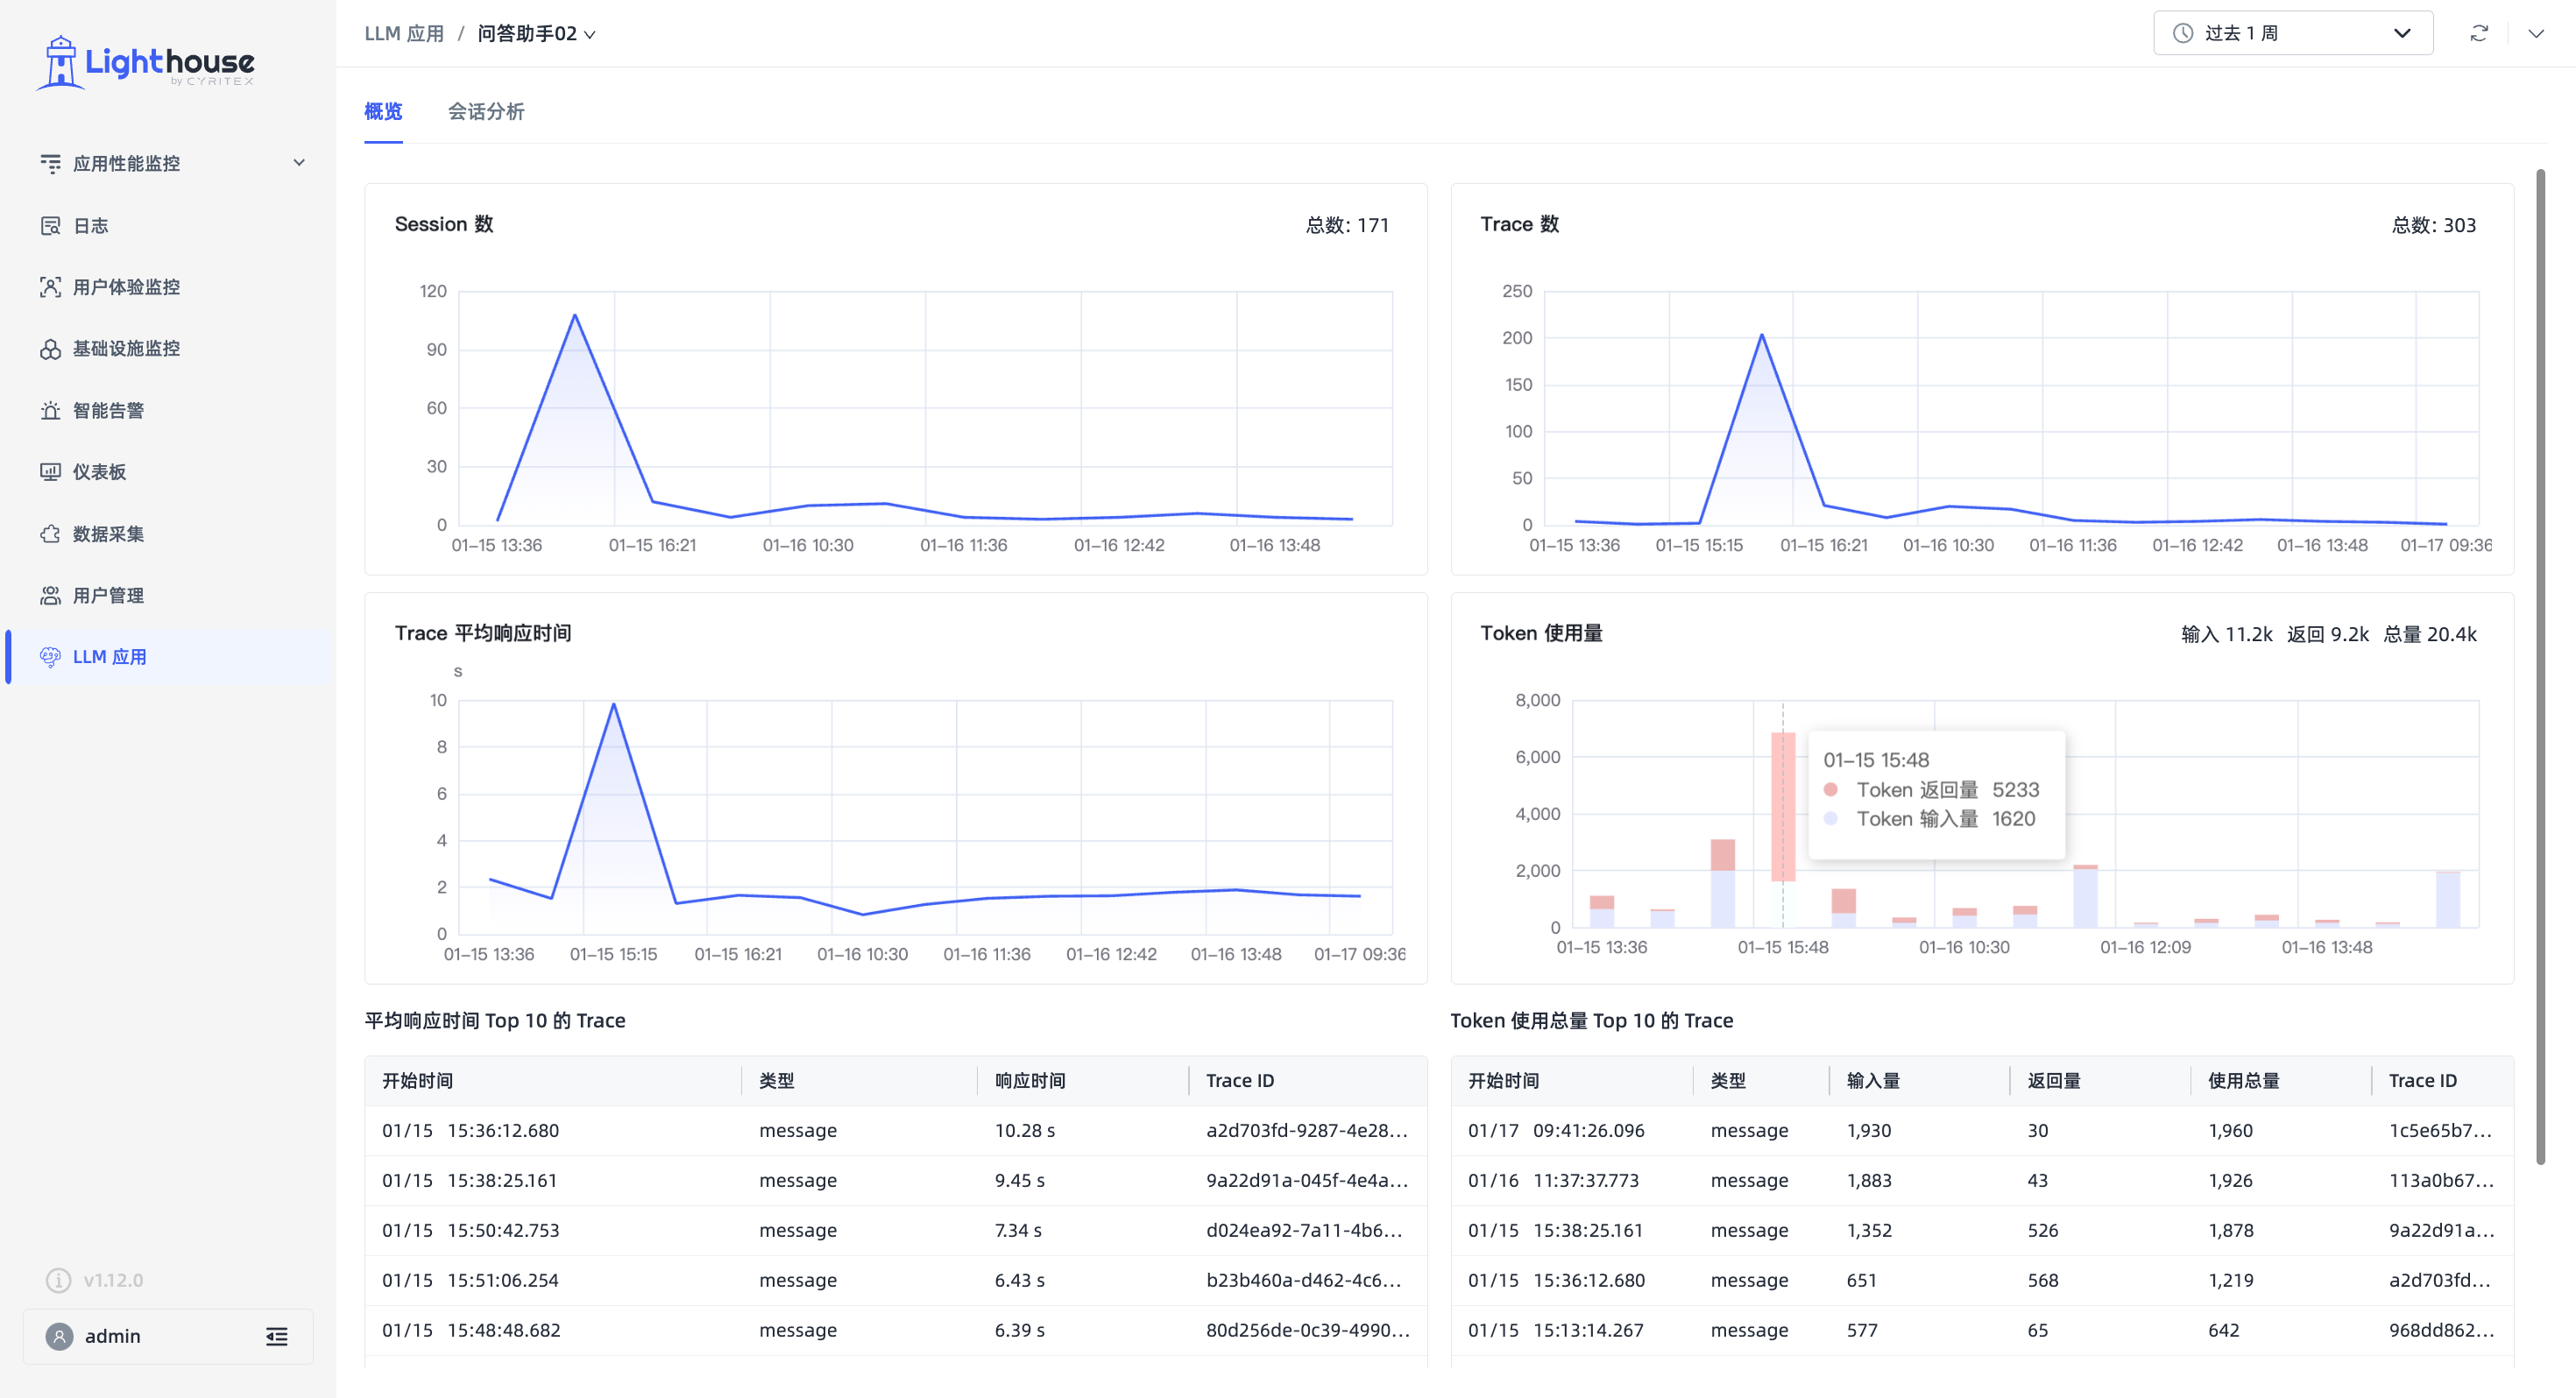
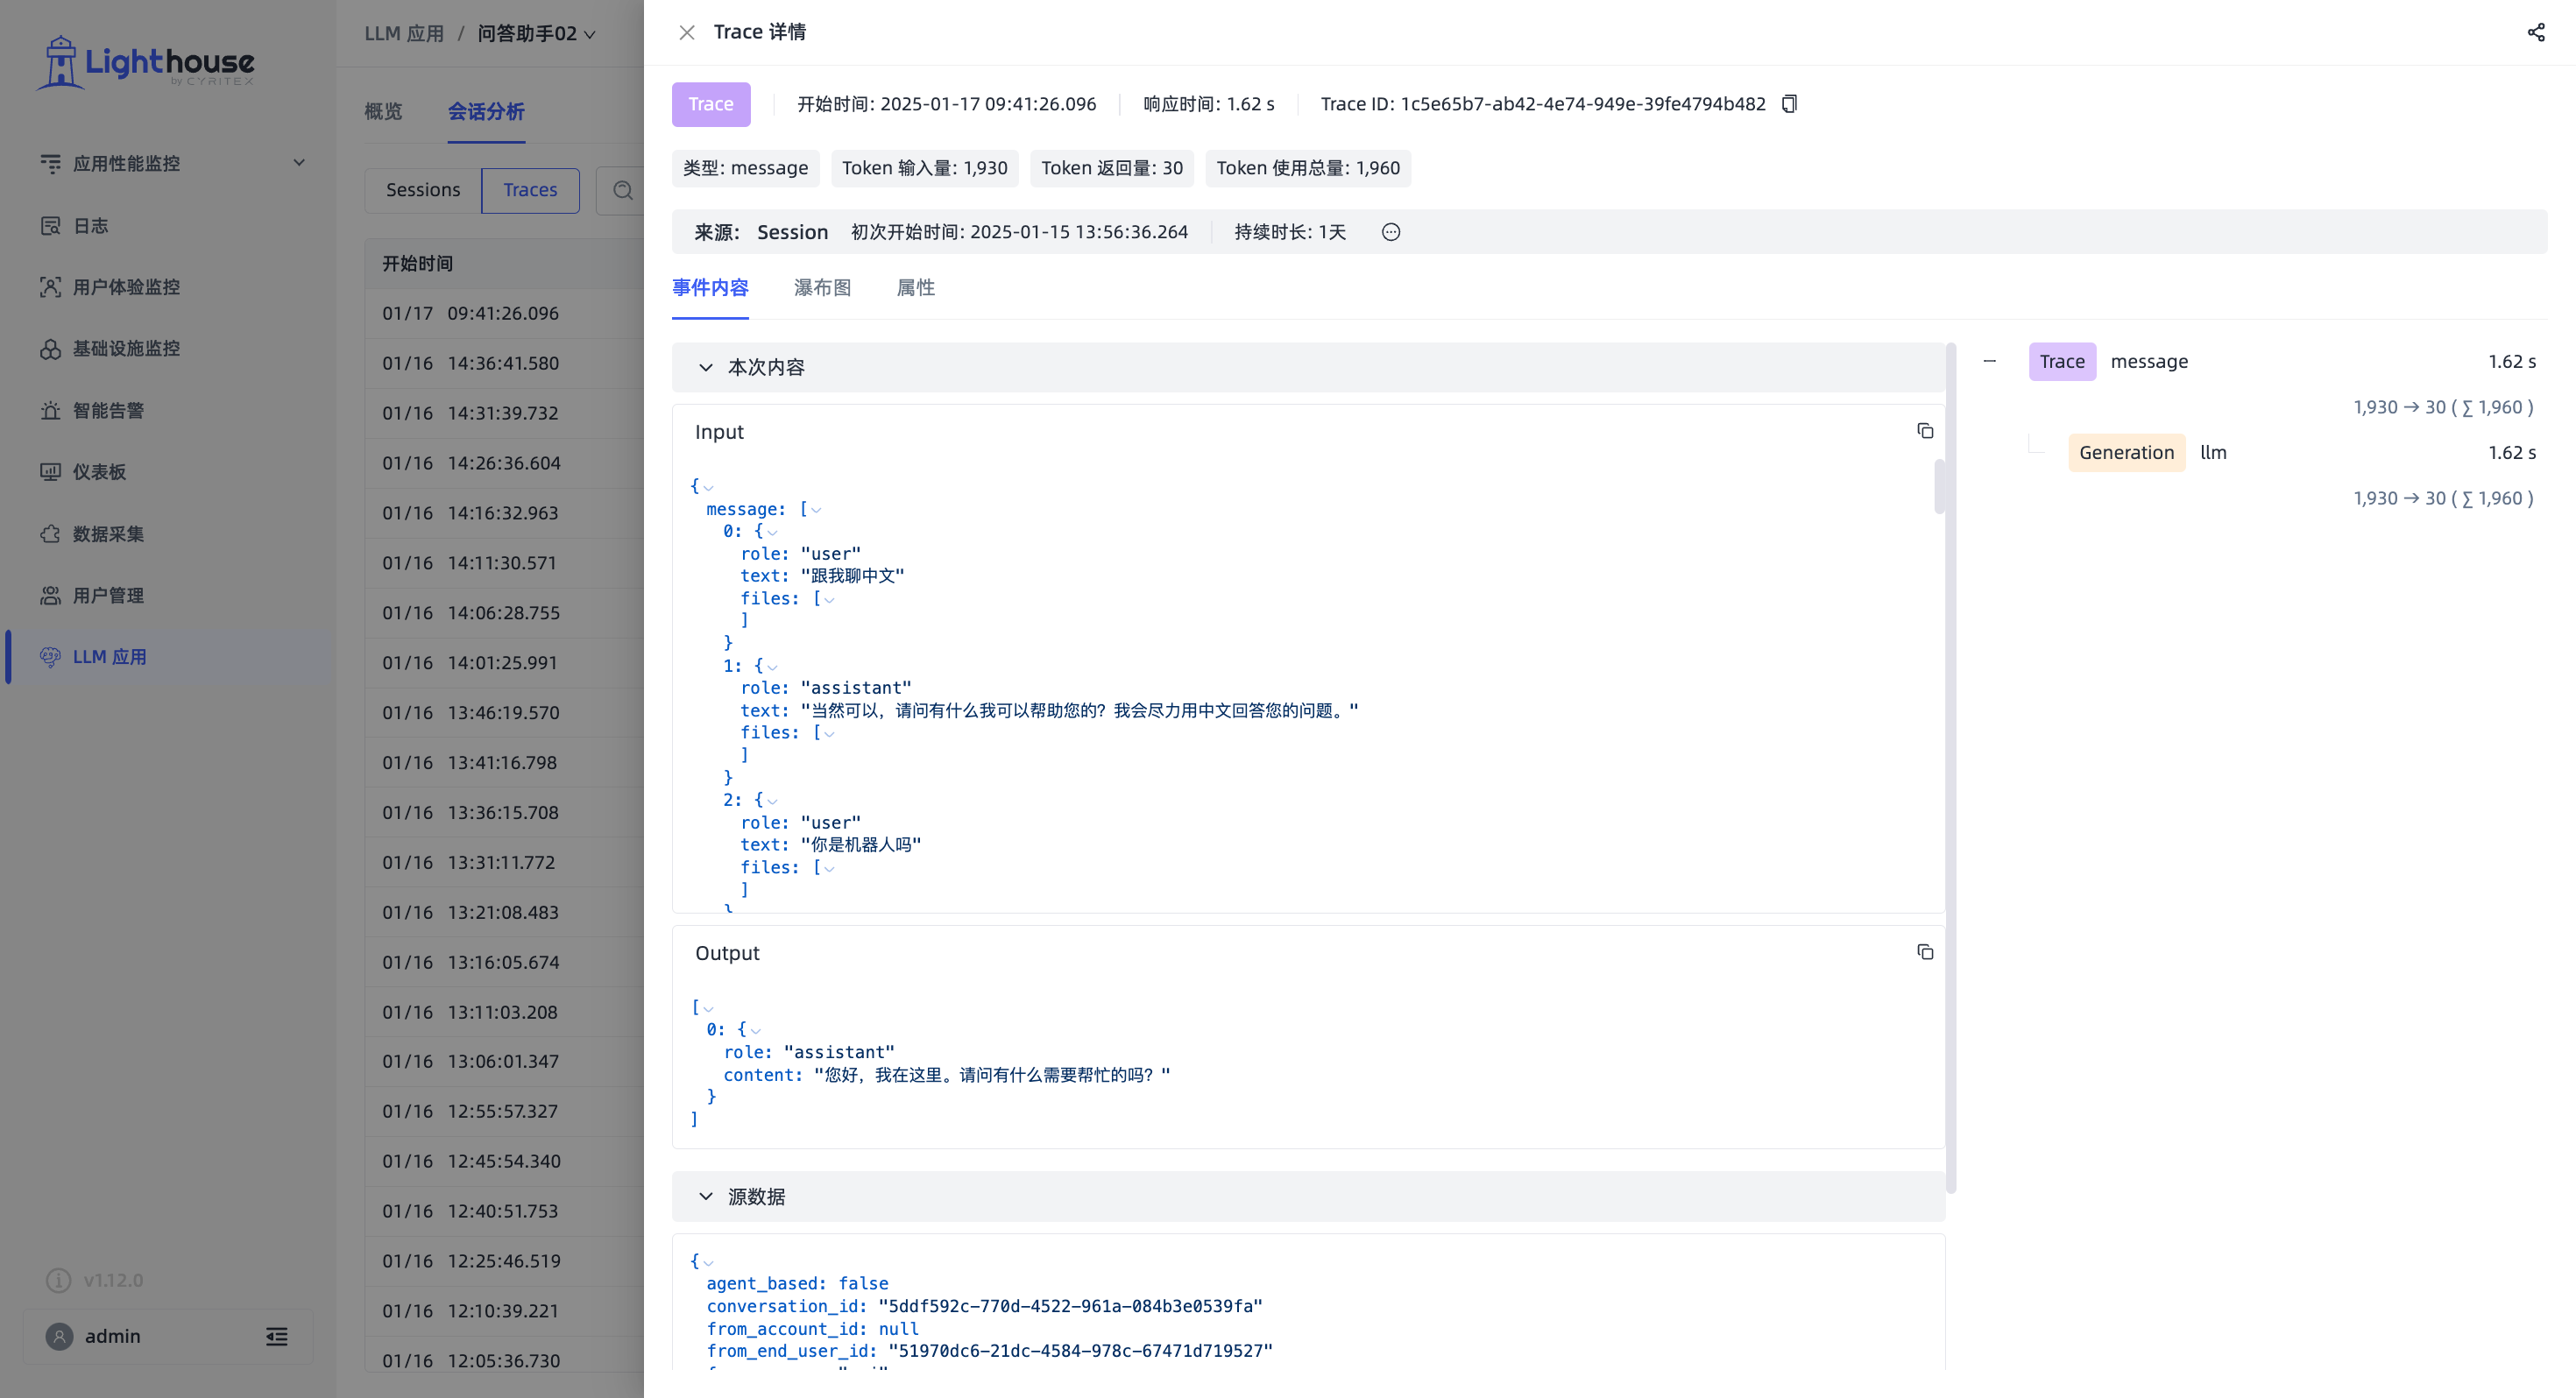
Lighthouse explores LLM application observability and officially launches the "LLM Applications" module, aiming to help enterprises monitor LLM application performance, identify performance bottlenecks, and optimize resource utilization.

Currently, Lighthouse can observe performance data and usage of LLM applications in the system at Session and Trace dimensions, such as input, output, response time, token consumption, etc.

imgimg

Features

  • APM: "Resource Analysis" module, added performance metrics display on hover for topology connection lines, showing metrics like call percentage, call count.
  • LOG: One-click navigation from single log details to associated trace details page.

v1.11.0 Release

· 3 min read

New Features

  • APM:
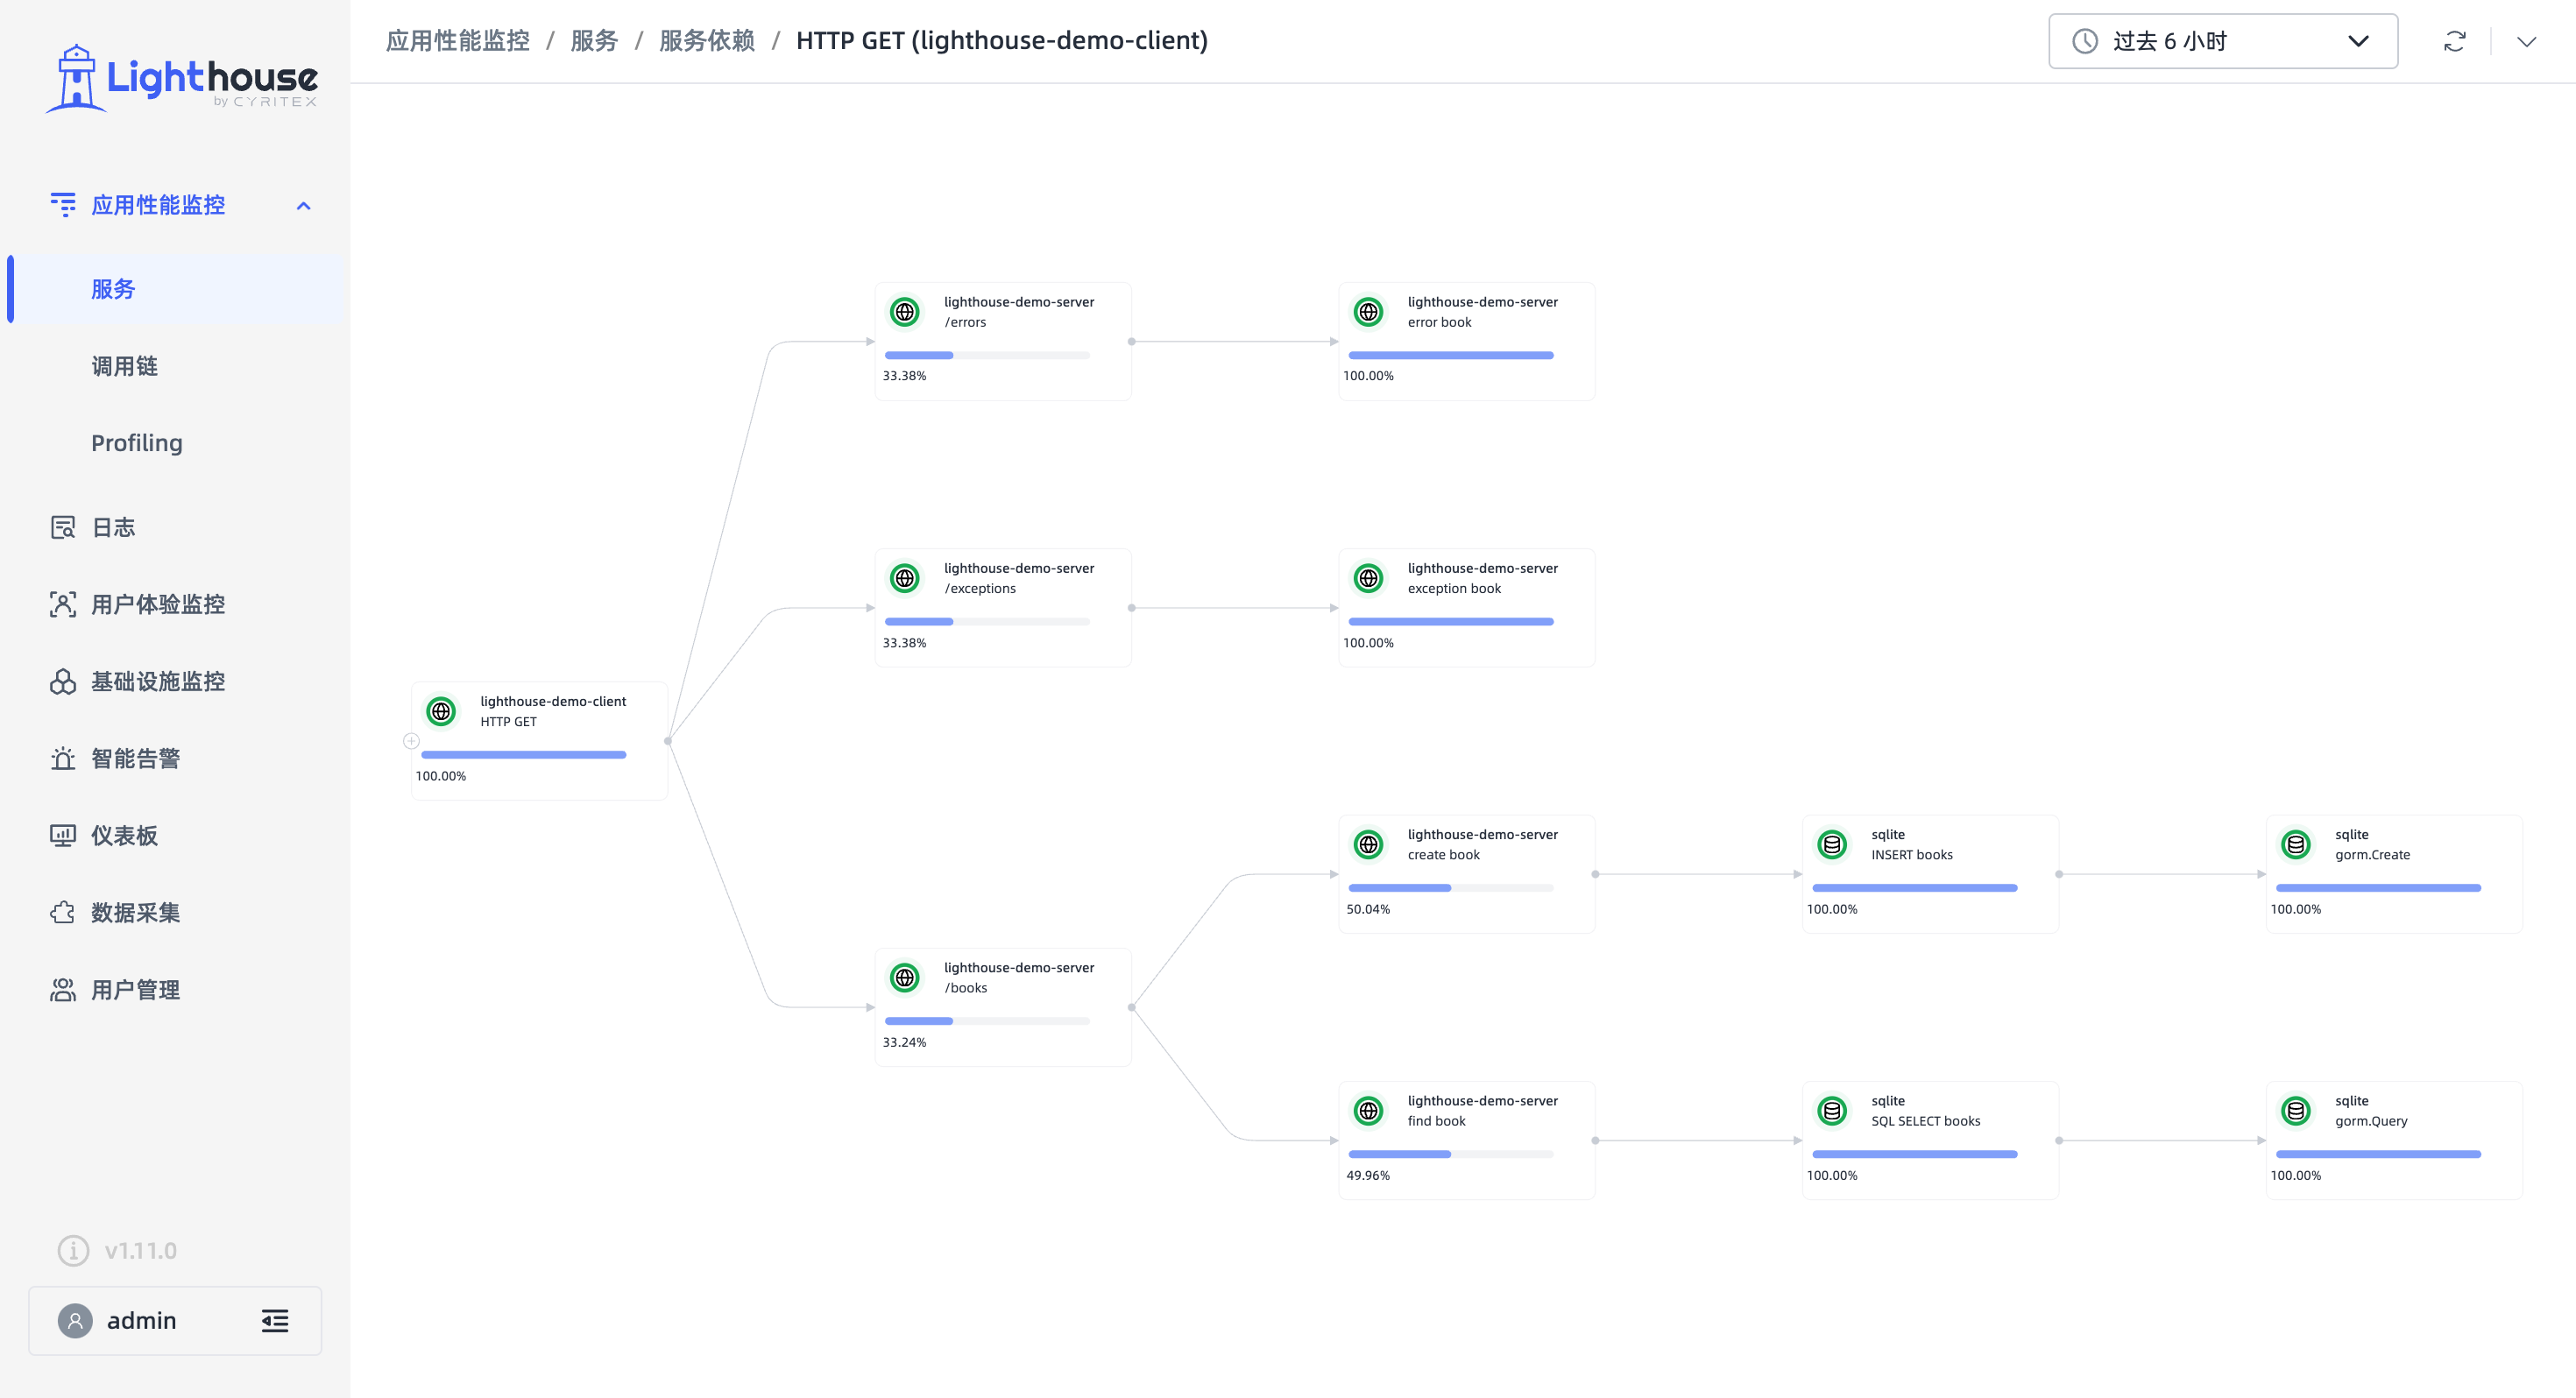
  1. Added "Service Dependencies" module, displaying collected resource performance data and call relationship topology.
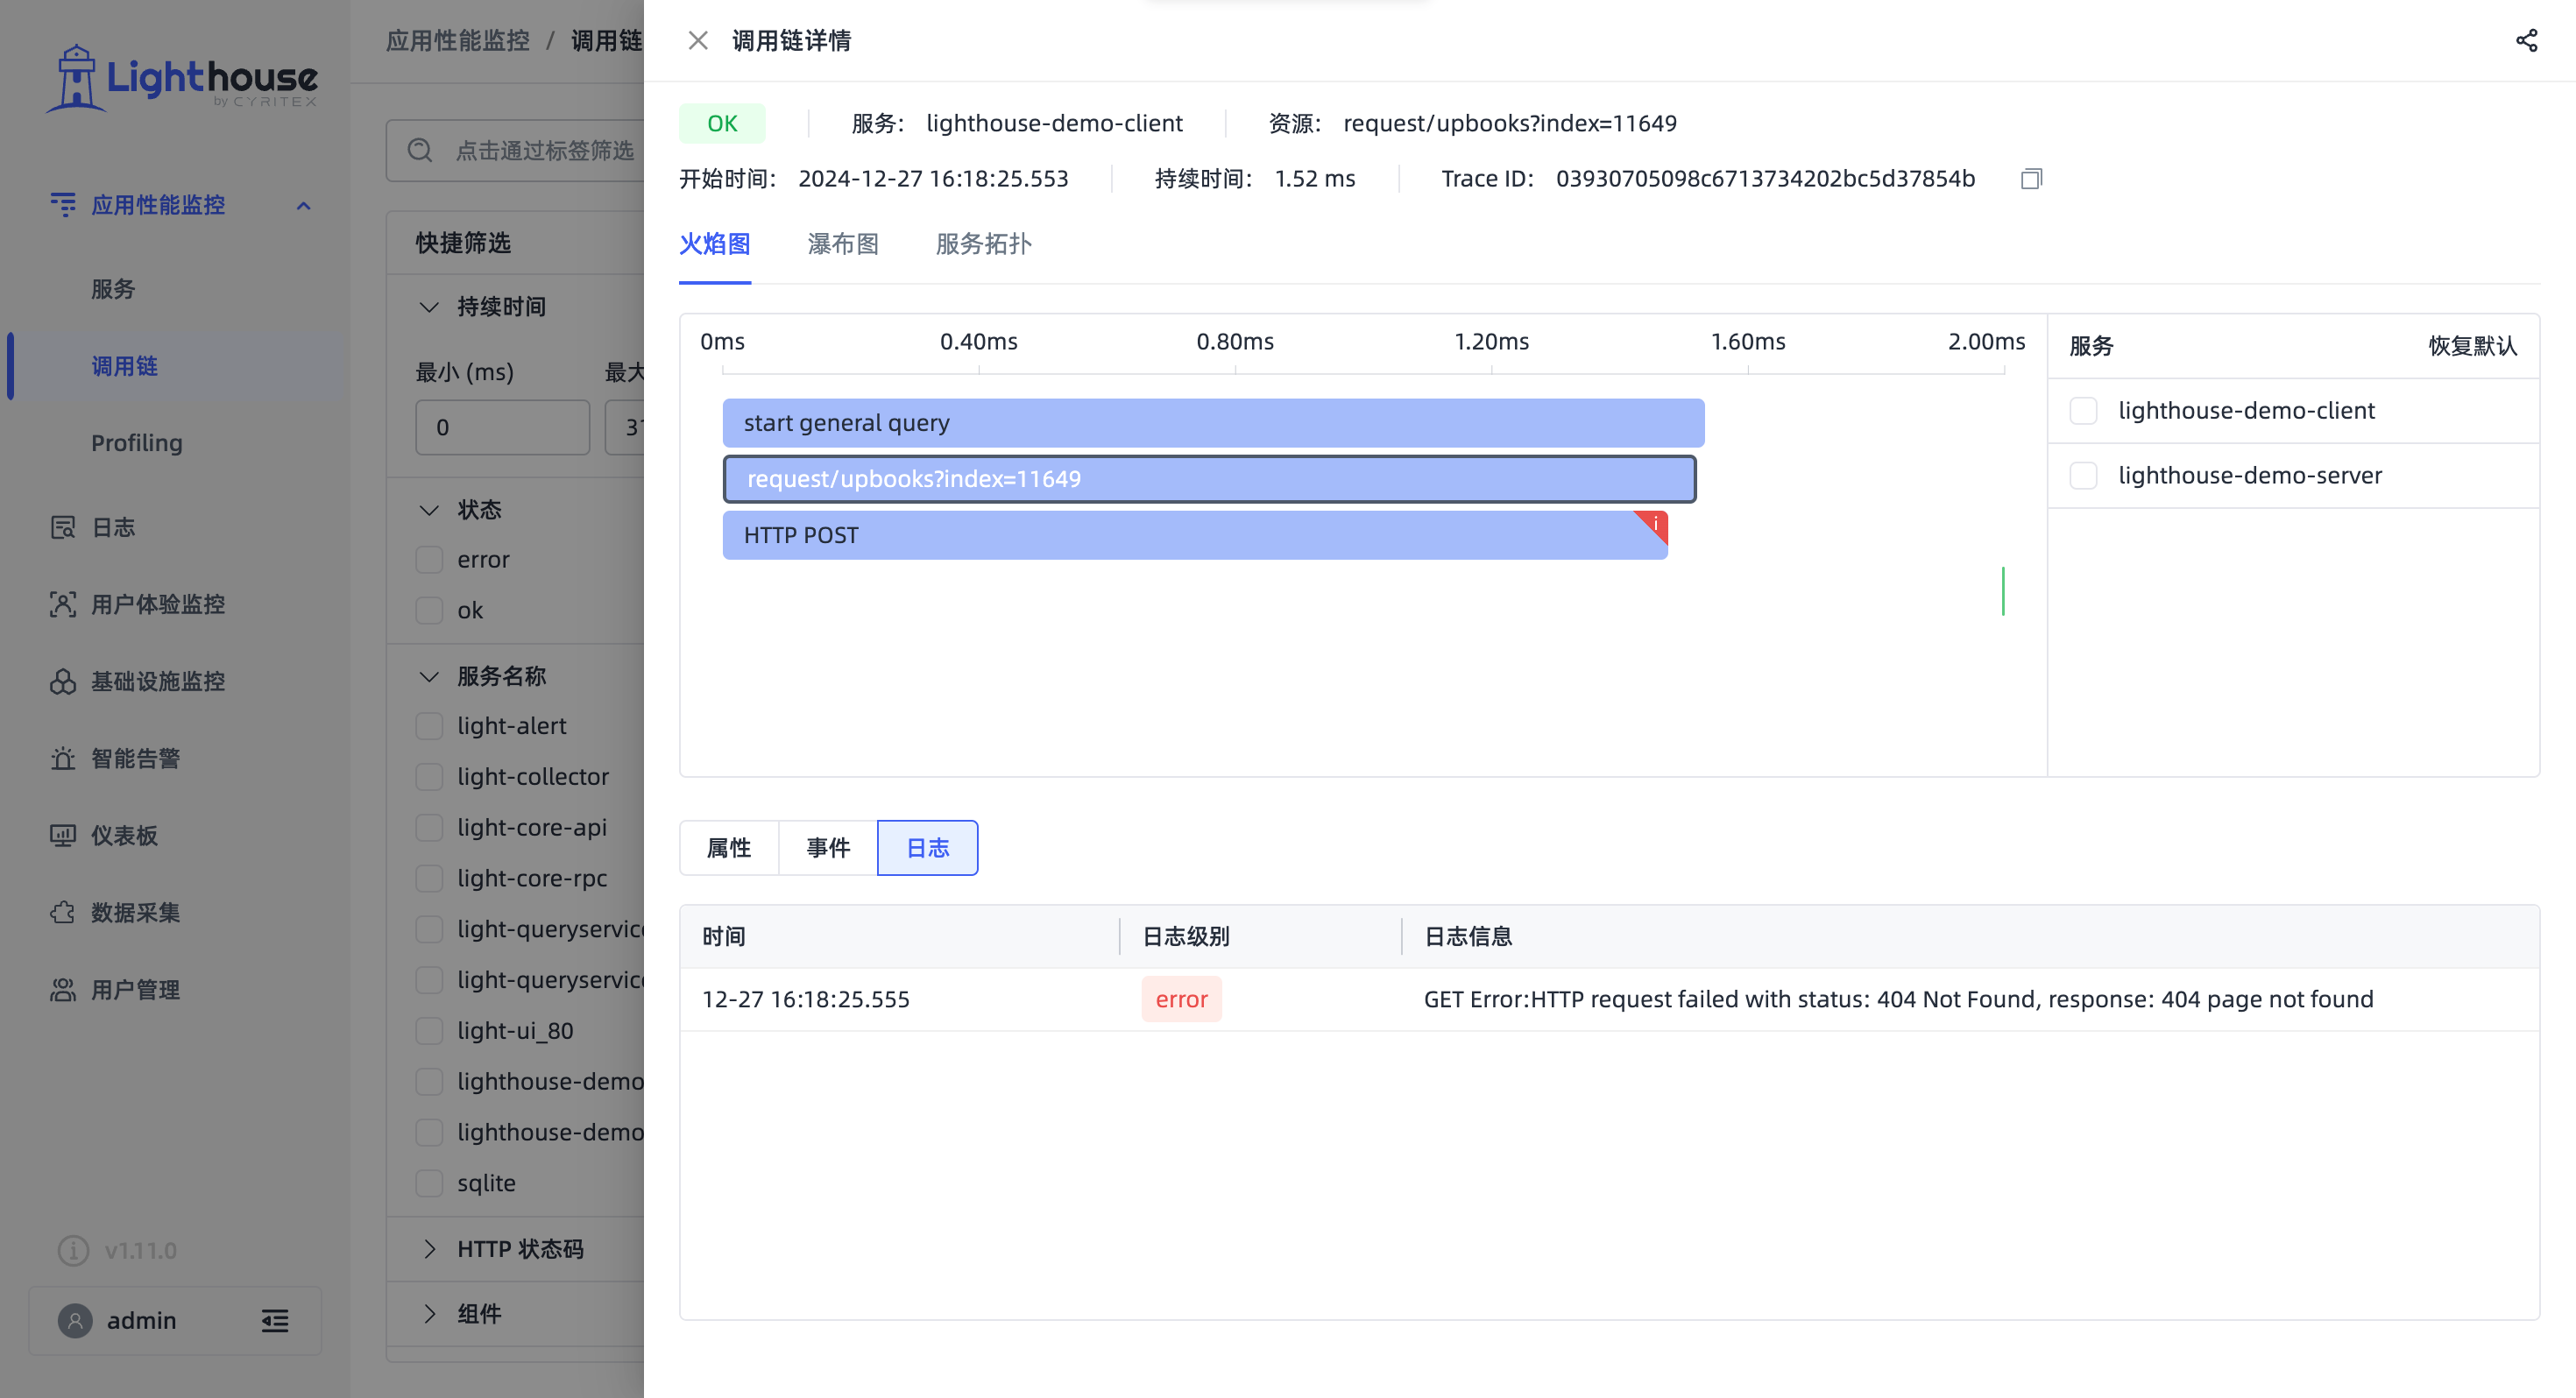
  2. Added associated log list display in trace detail page.
imgimg

v1.6.0 Release

· One min read

Features

  1. RUM: Added View type performance data and detail page in Session Analysis module
  2. ITIM: Added honeycomb chart visualization for hosts and containers
  3. Dashboard: Added bar chart and table chart types
  4. Alerts:
    1. Added Webhook and Feishu bot support for alert notifications
    2. Added standard alert content templates with customization support
    3. Added detail page for alert records to view metric trends during alert trigger period