4 posts tagged with "Log"

Some new log features

View all tags

v1.15.0 Release

· 2 min read

Features

  • Logs: Support full-text and fuzzy search for log messages. Searched content will be highlighted in blue within the log list or hover tooltips.
  • Dashboard:
    • New chart types: Number Overview, Pie Chart, and Text.
    • When selecting metrics, field names and metric descriptions are displayed simultaneously to help users quickly select desired data metrics.
    • Automatically matches appropriate units after metric selection. When users manually modify units, appropriate data conversion is performed.
    • Support for custom fill colors.
  • RUM: Quick filtering and search capabilities for performance event information in the View details page.
  • Alerts: Alert policy details page now includes statistics and filtering capabilities for different severity levels of alert records.
  • Added settings buttons to Dashboard, RUM, and LLM applications for quick access to settings pages.
v1.13.0 Release Notes

· One min read

New Features

  • APM:
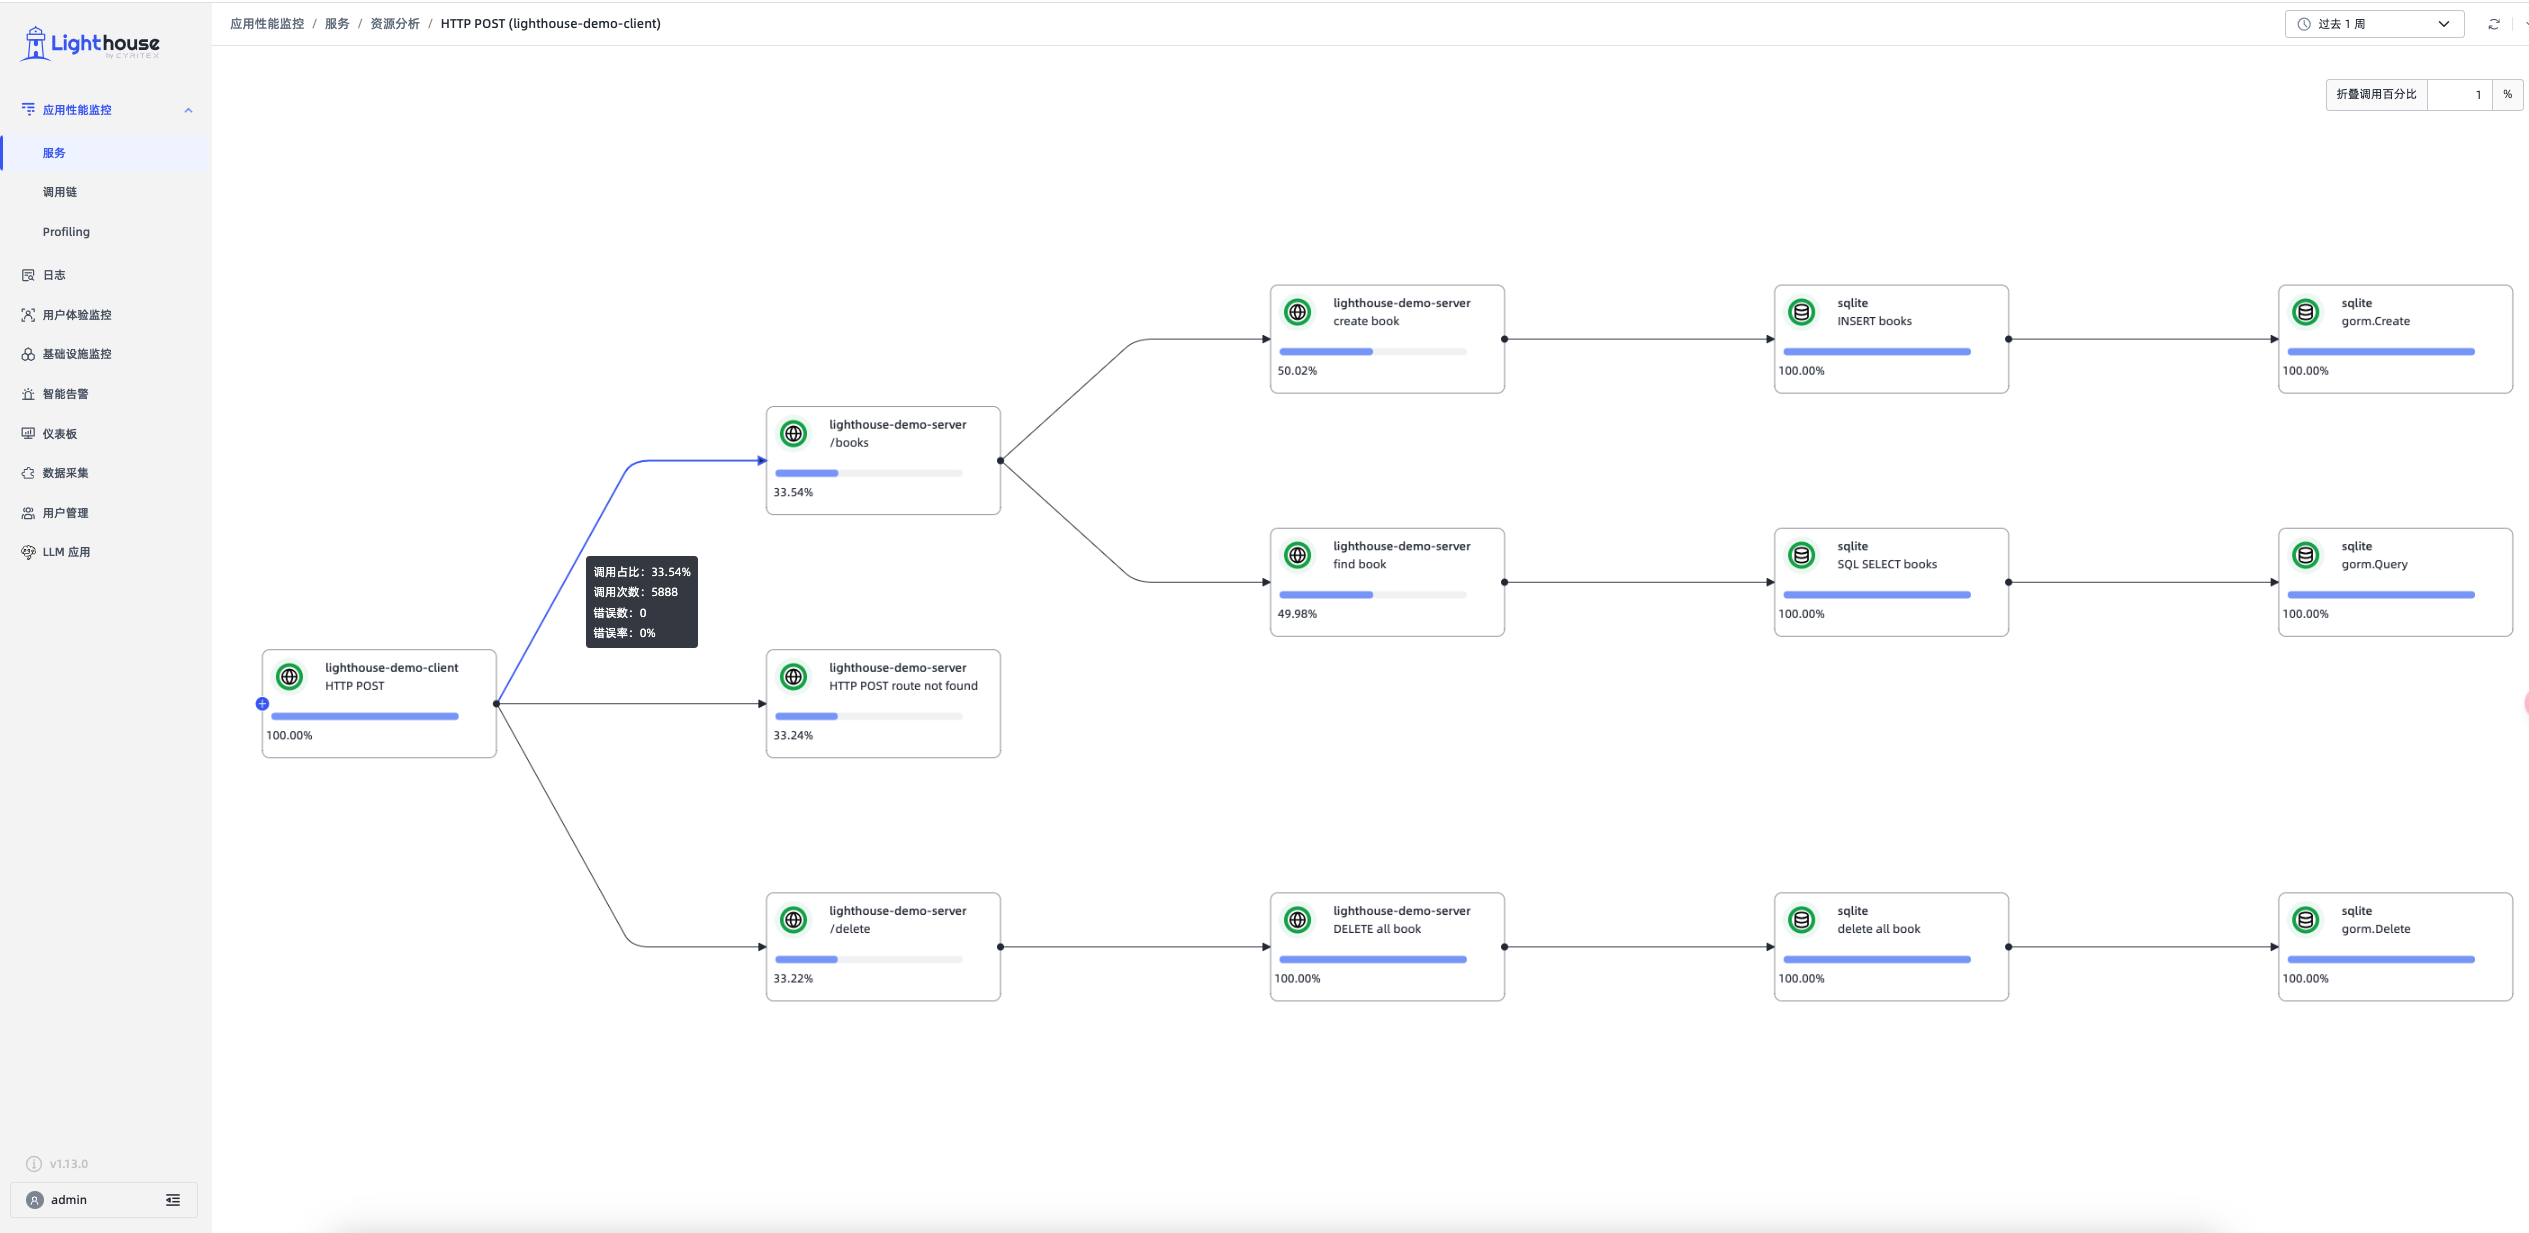
  1. Added error information display to the topology graph in the "Resource Analysis" module.
  2. Added multiple user experience improvements. img

Bug Fixes

  1. Fixed an issue where clicking on log alert record details in "Smart Alerts" resulted in an error.
  2. Fixed incorrect unit display in the application list of "LLM Applications".
  3. Fixed an issue where the application list in "LLM Applications" was not filtering by custom time range.
  4. Fixed an issue where the Top 10 list in "LLM Applications" was not filtering by custom time range.
  5. Fixed incorrect trace count display on the probability page in "LLM Applications".
  6. Fixed abnormal trace filtering issues in "Service Details".
  7. Fixed incorrect duration display for top-level spans in some "APM" flame graphs.
  8. Fixed an issue where clicking on the honeycomb chart in "Infrastructure Monitoring" cleared the left-side filters.

v1.12.0 Release Notes

· 3 min read

Breaking Changes

Breaking Changes

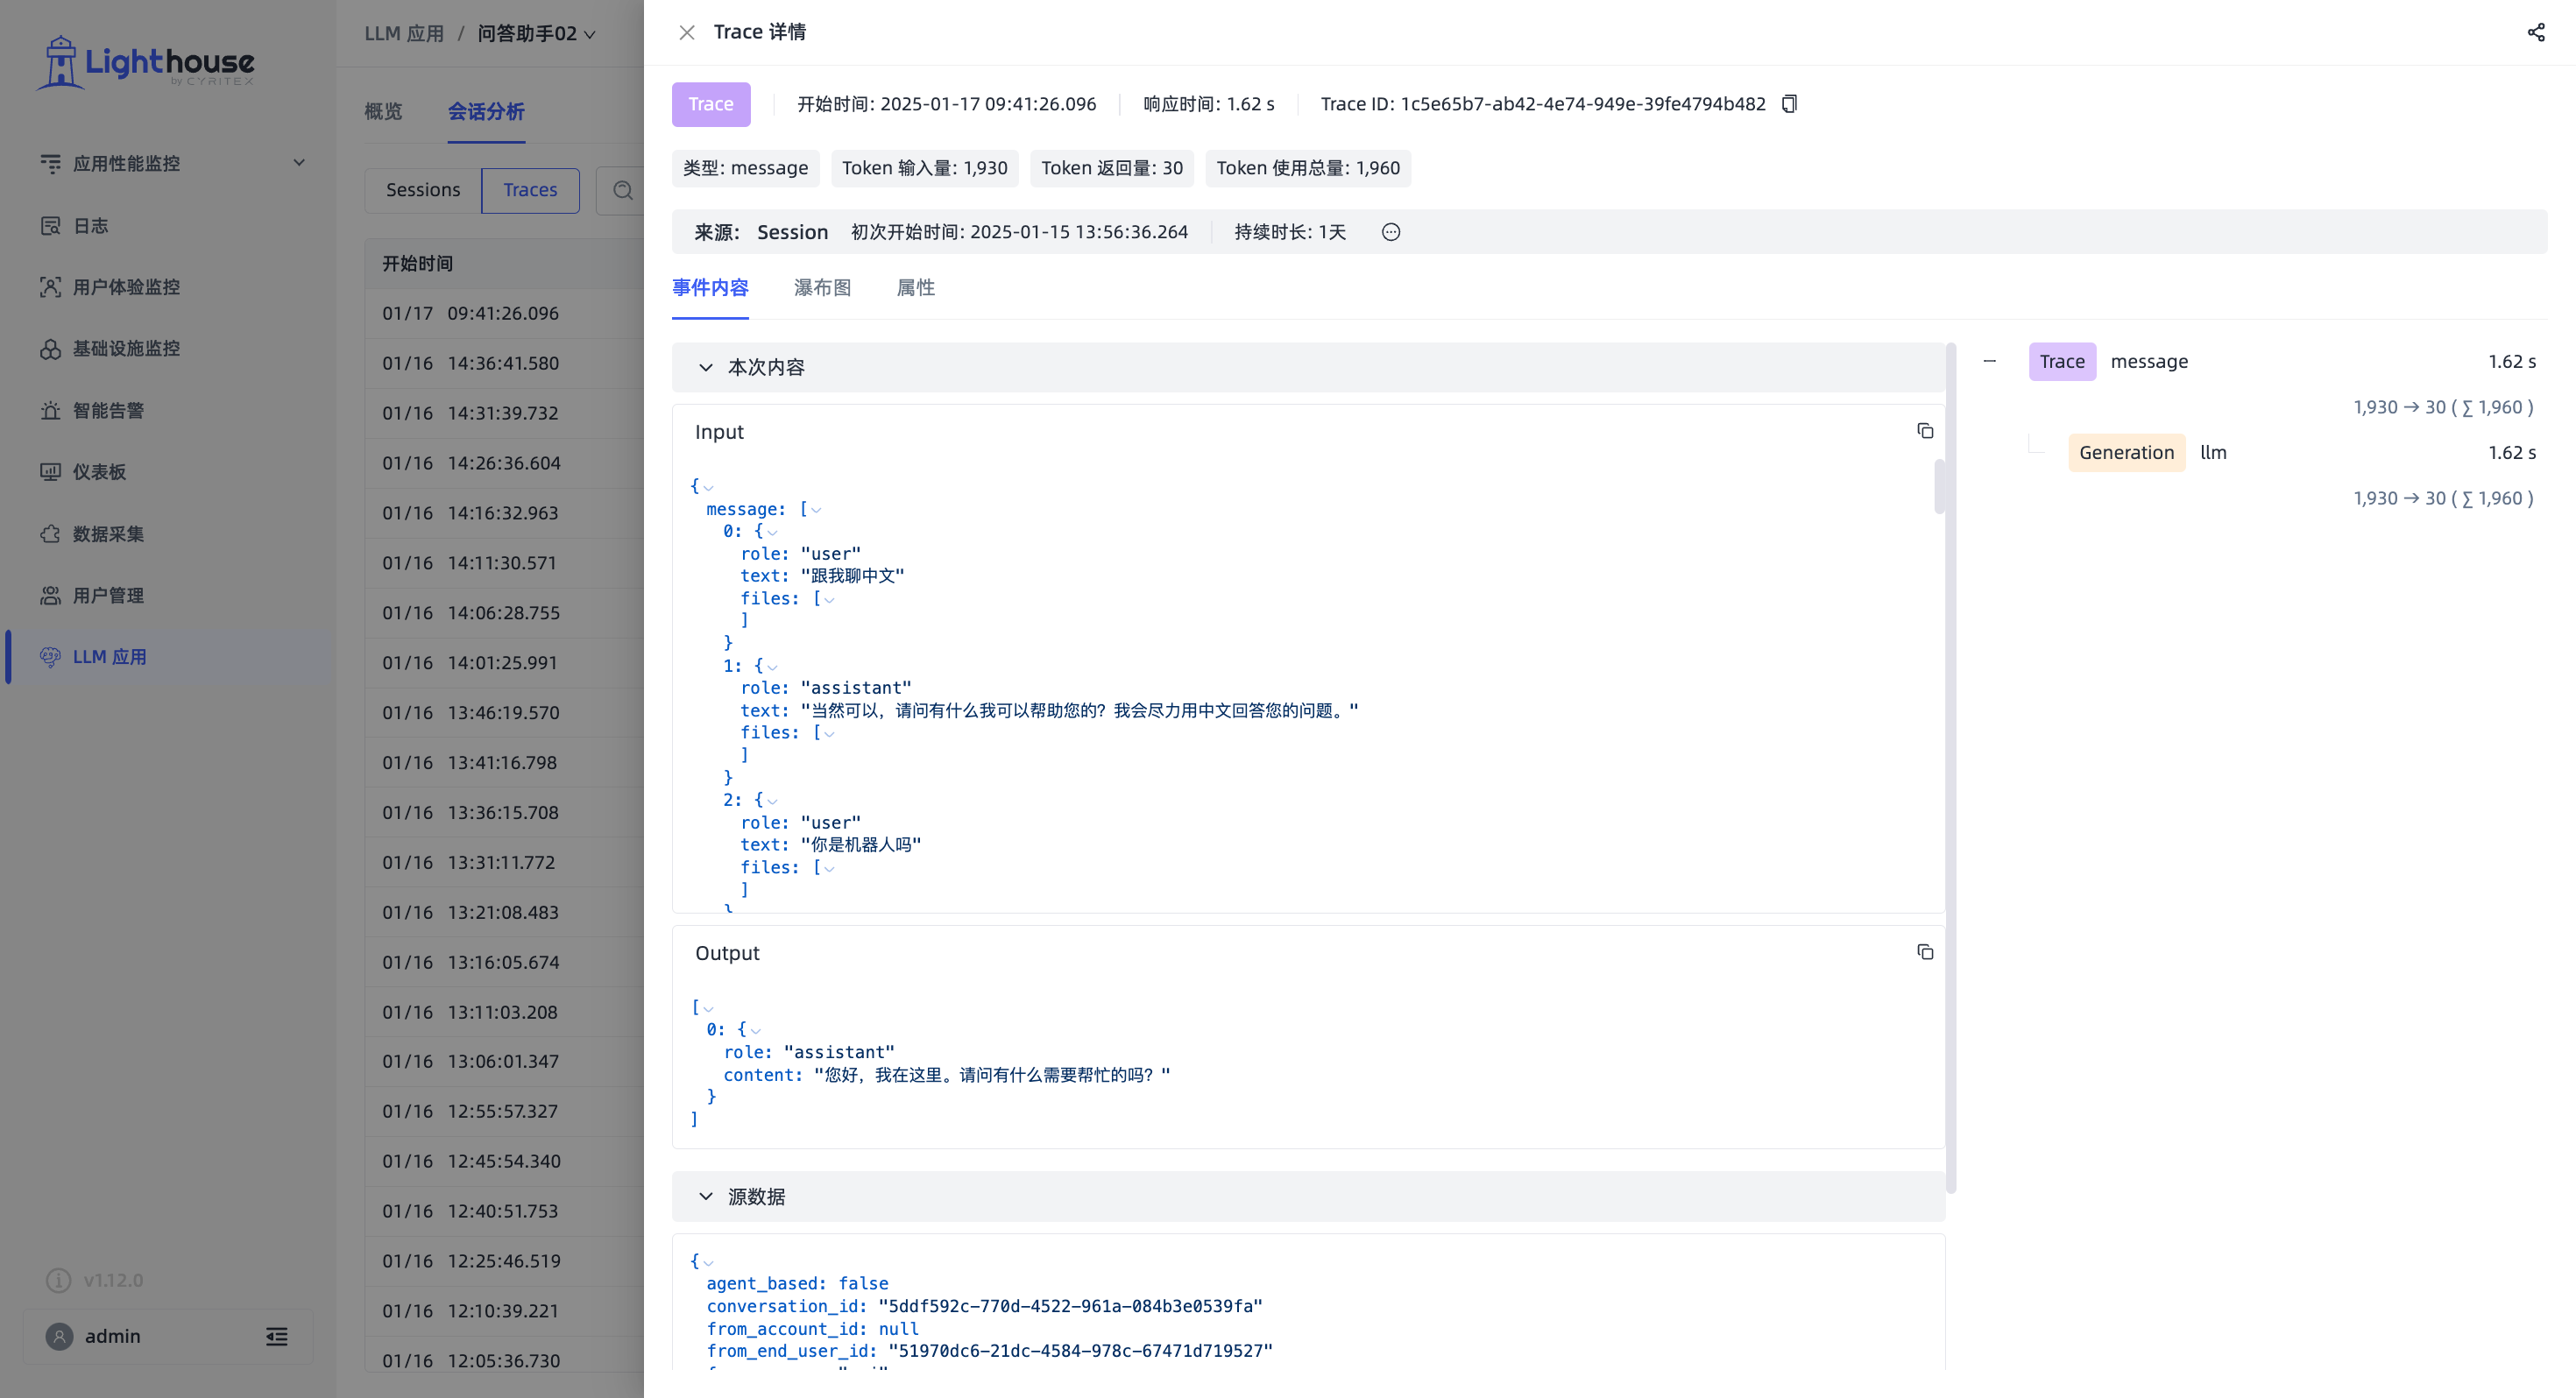
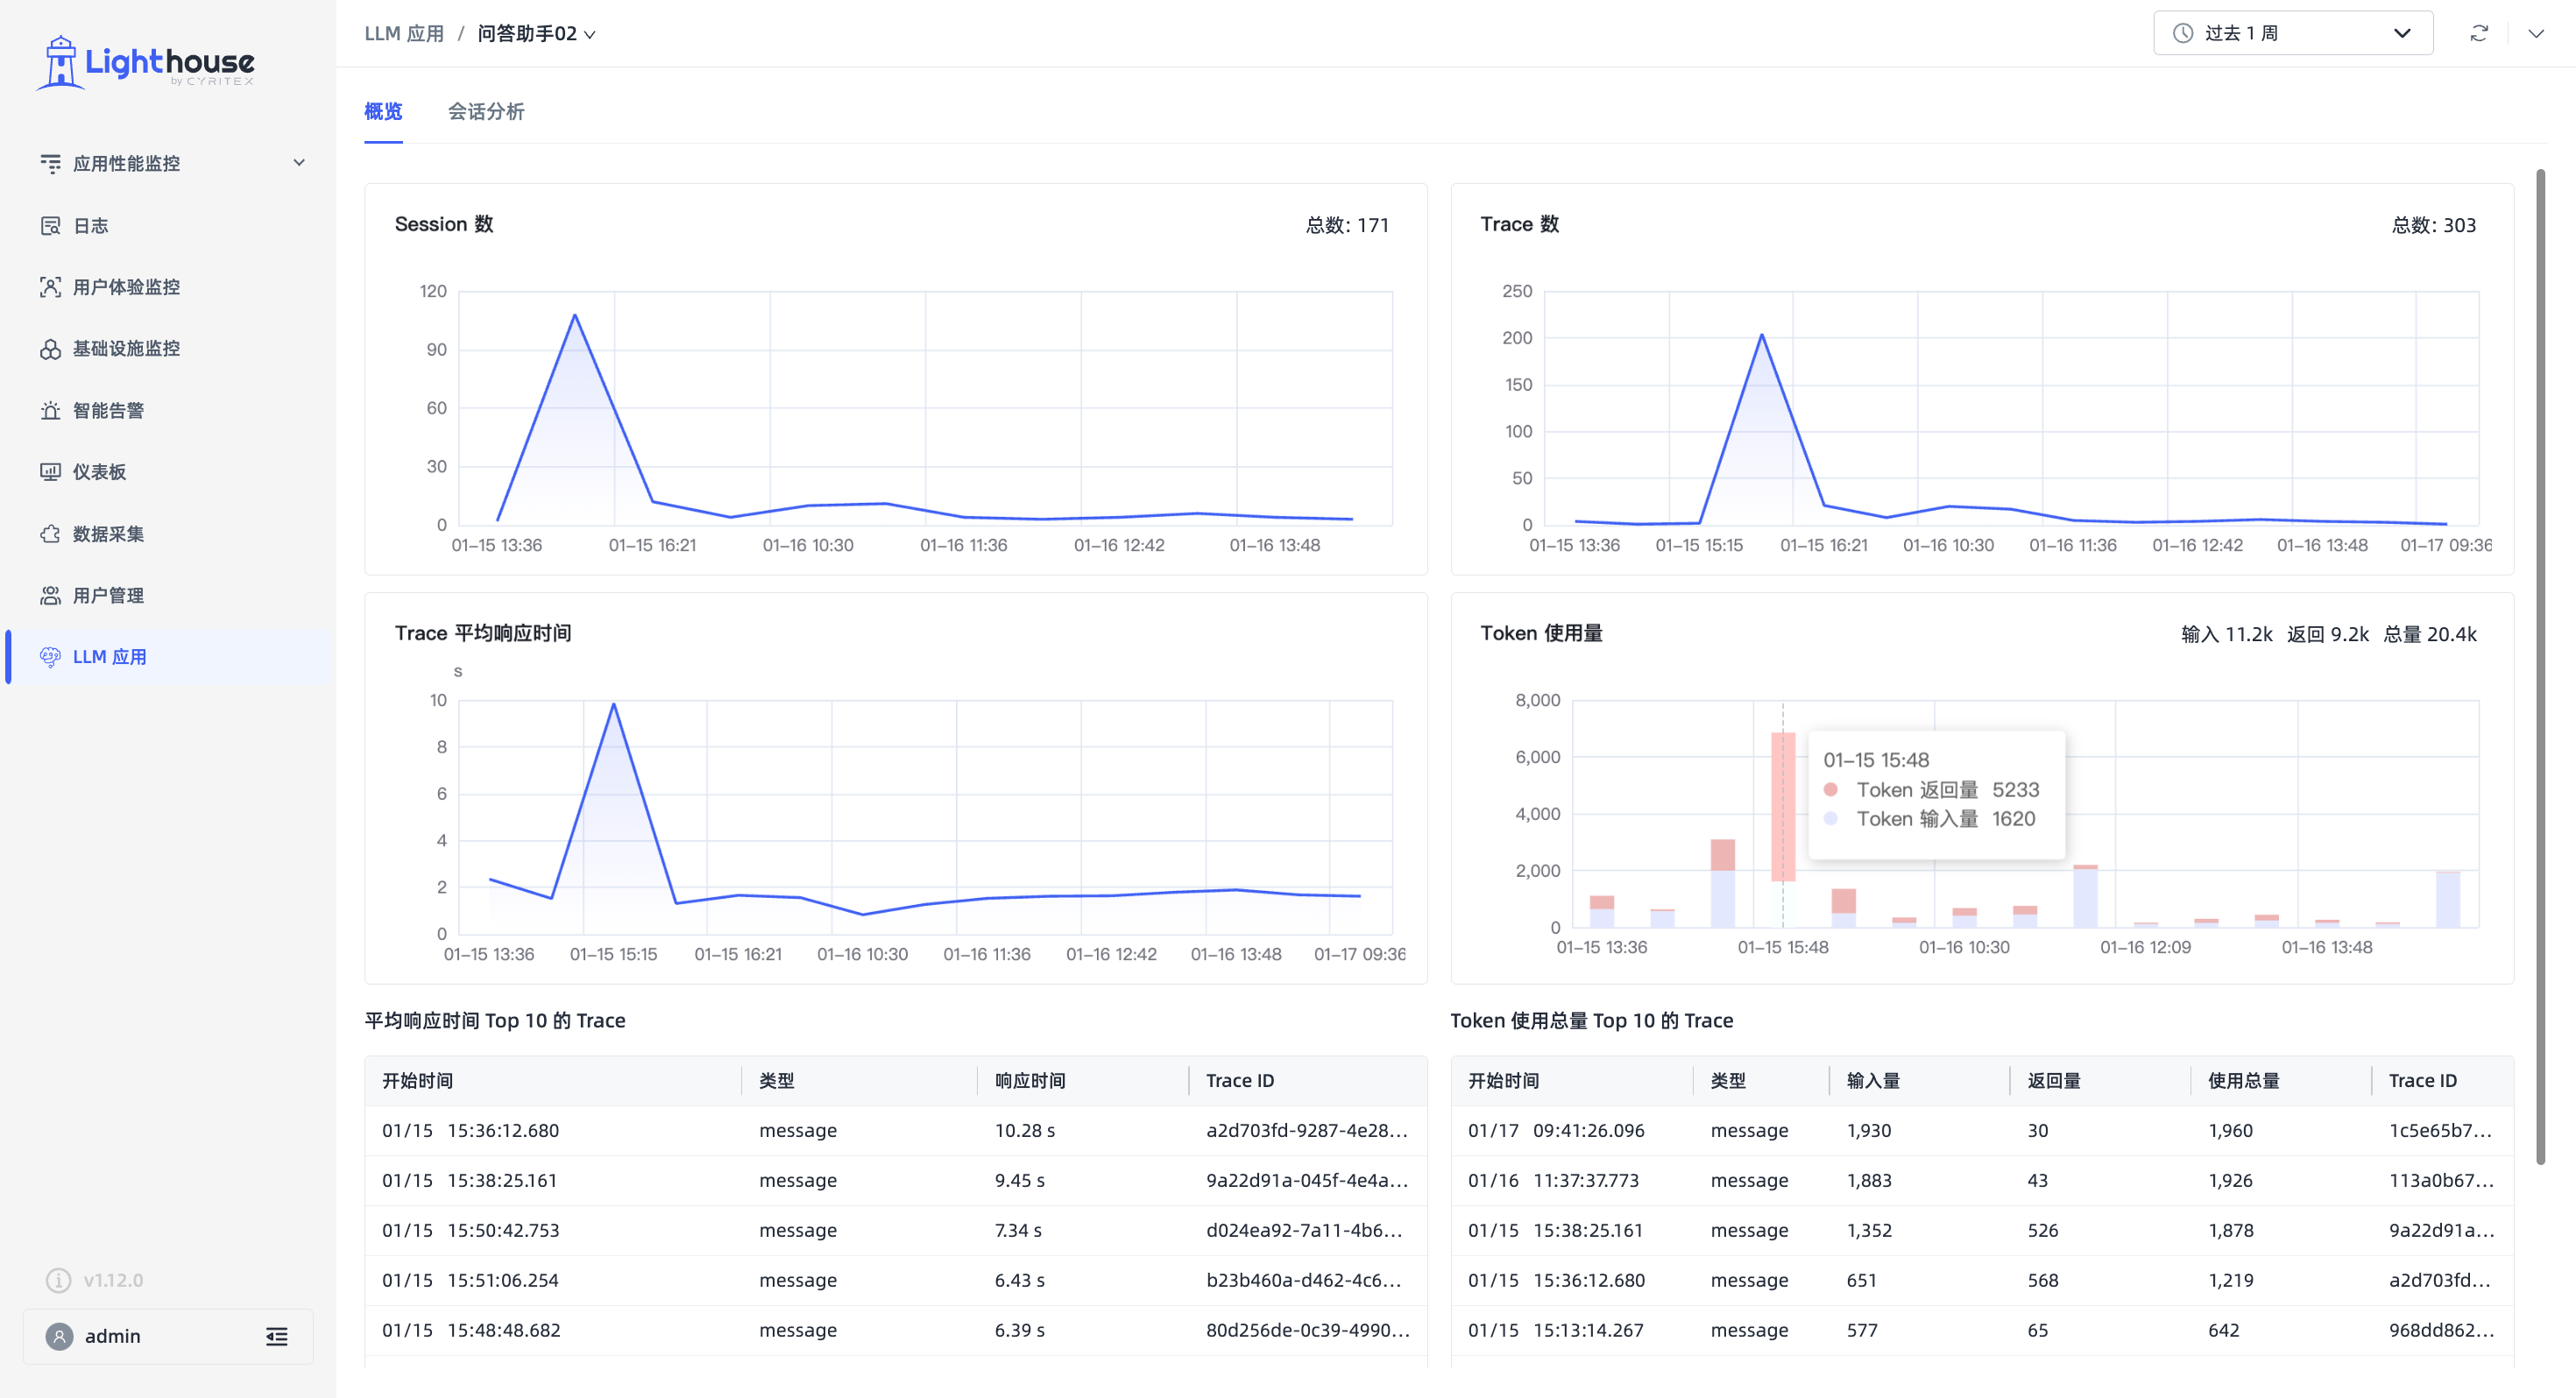
Lighthouse explores LLM application observability and officially launches the "LLM Applications" module, aiming to help enterprises monitor LLM application performance, identify performance bottlenecks, and optimize resource utilization.

Currently, Lighthouse can observe performance data and usage of LLM applications in the system at Session and Trace dimensions, such as input, output, response time, token consumption, etc.

imgimg

Features

  • APM: "Resource Analysis" module, added performance metrics display on hover for topology connection lines, showing metrics like call percentage, call count.
  • LOG: One-click navigation from single log details to associated trace details page.

v1.11.0 Release

· 3 min read

New Features

  • APM:
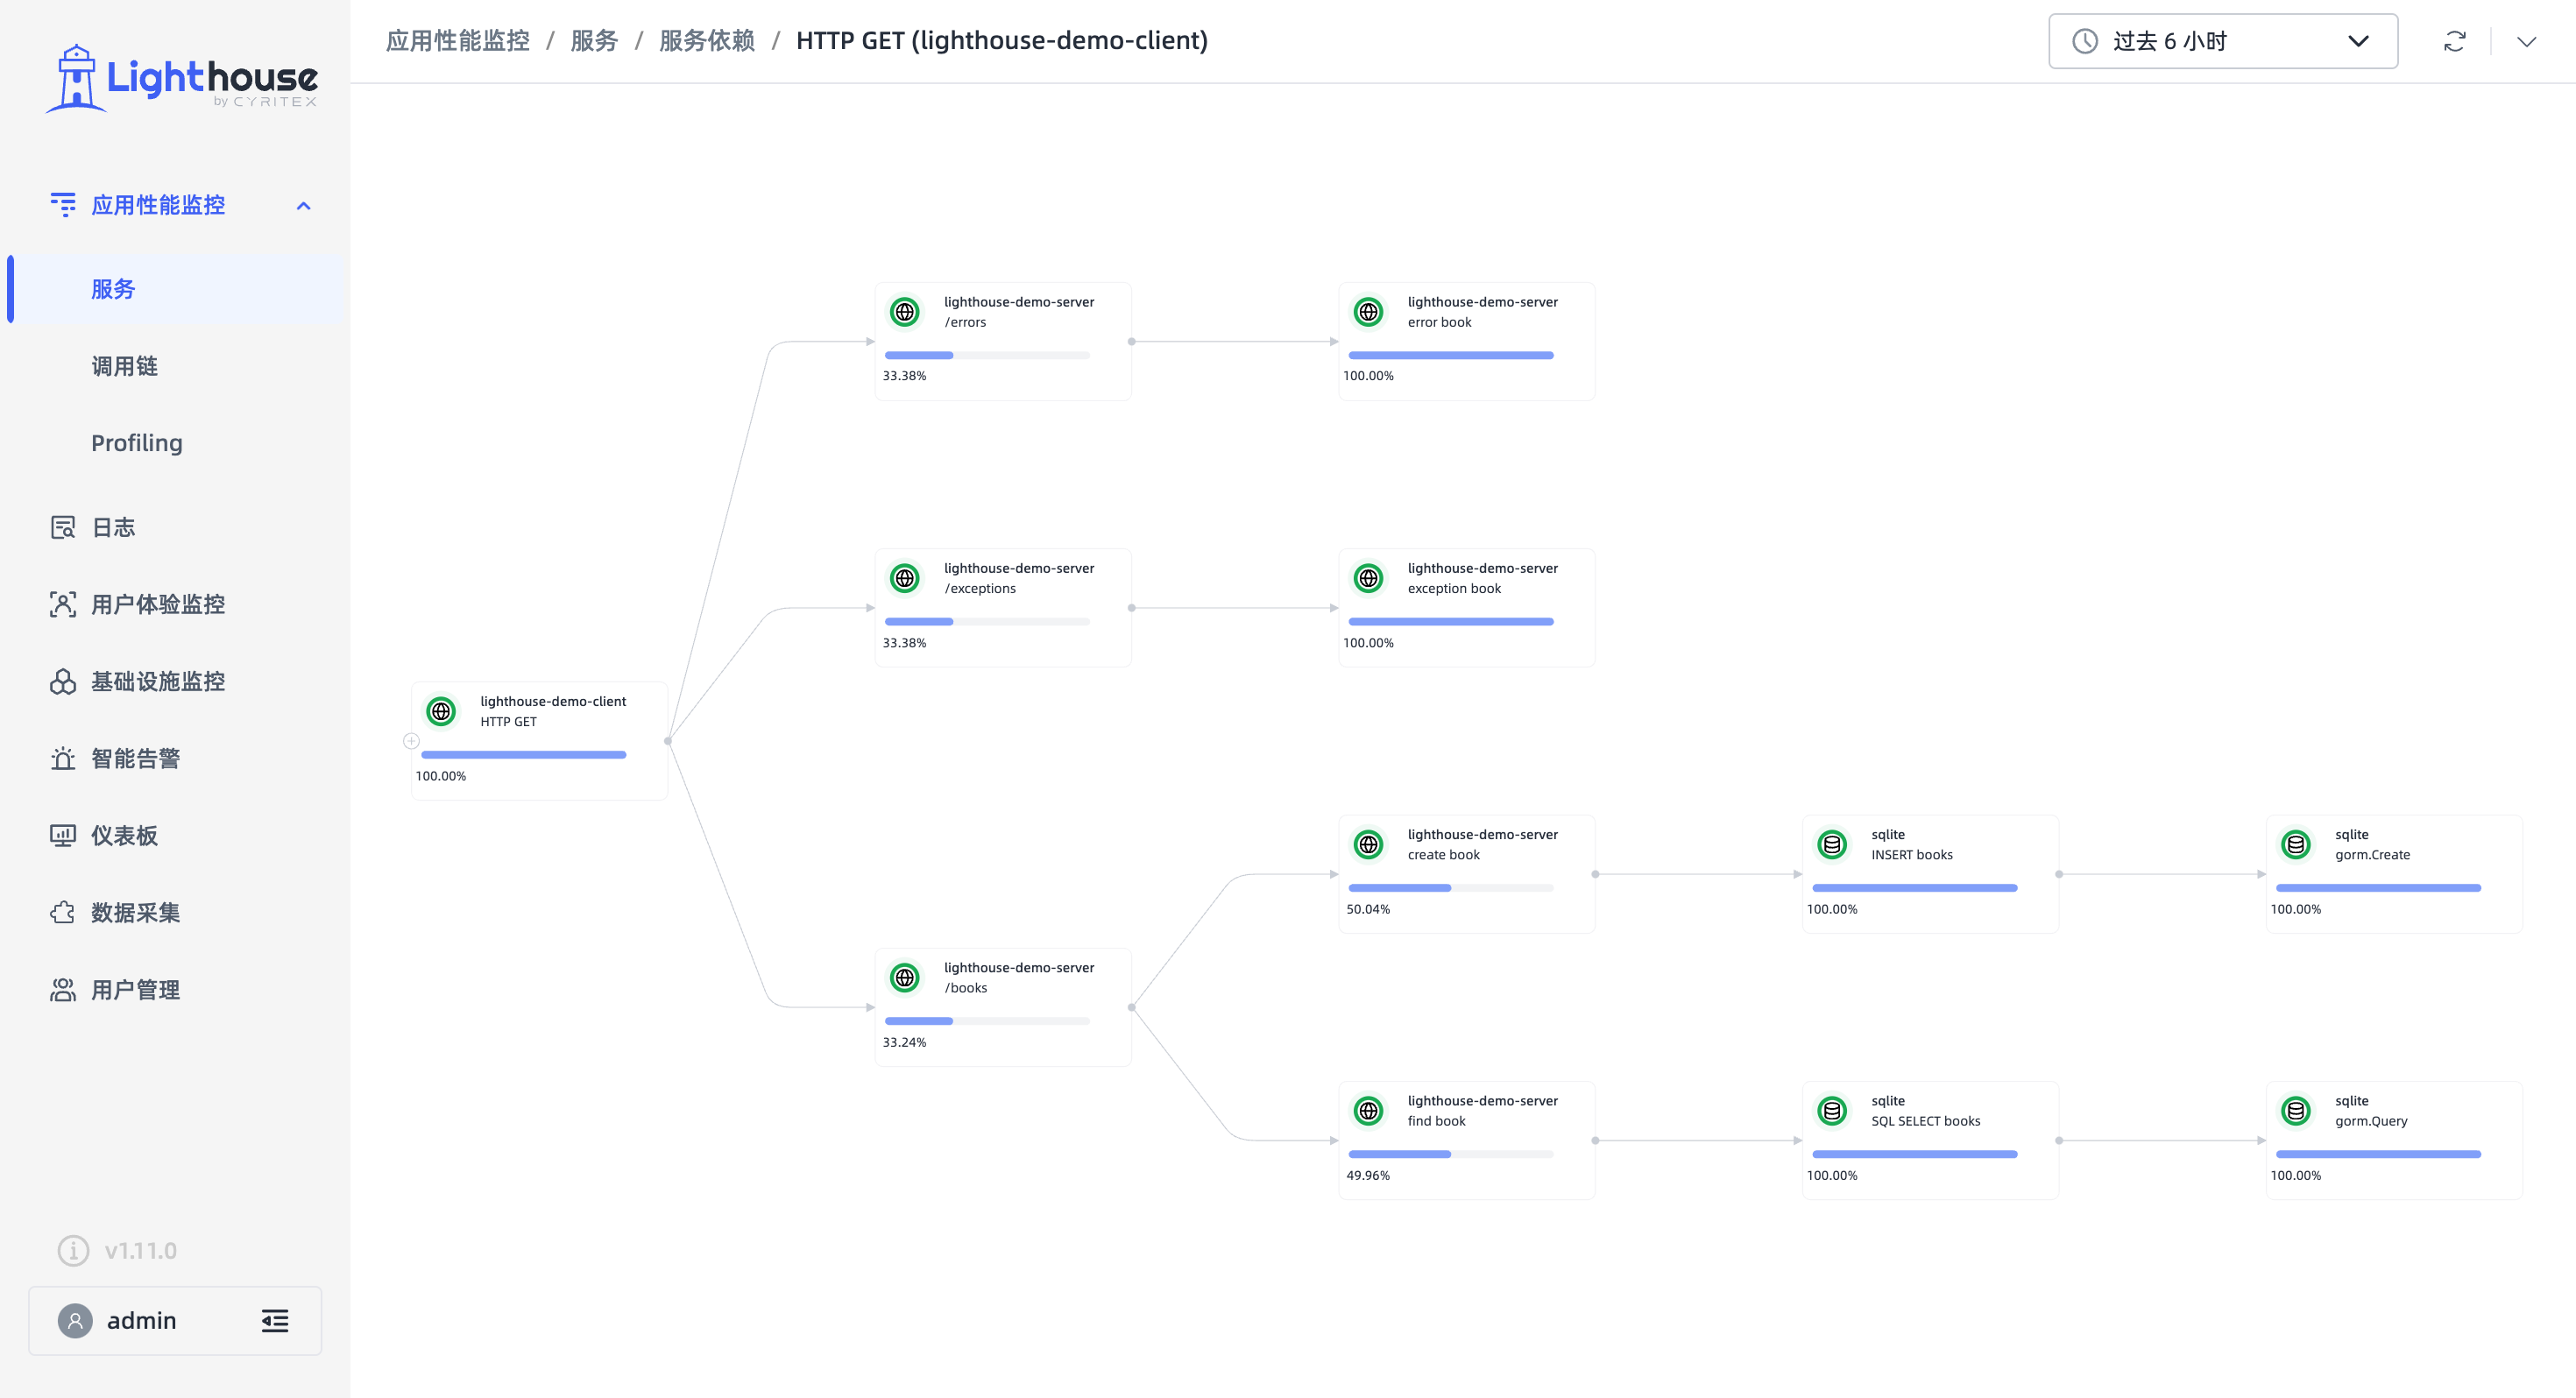
  1. Added "Service Dependencies" module, displaying collected resource performance data and call relationship topology.
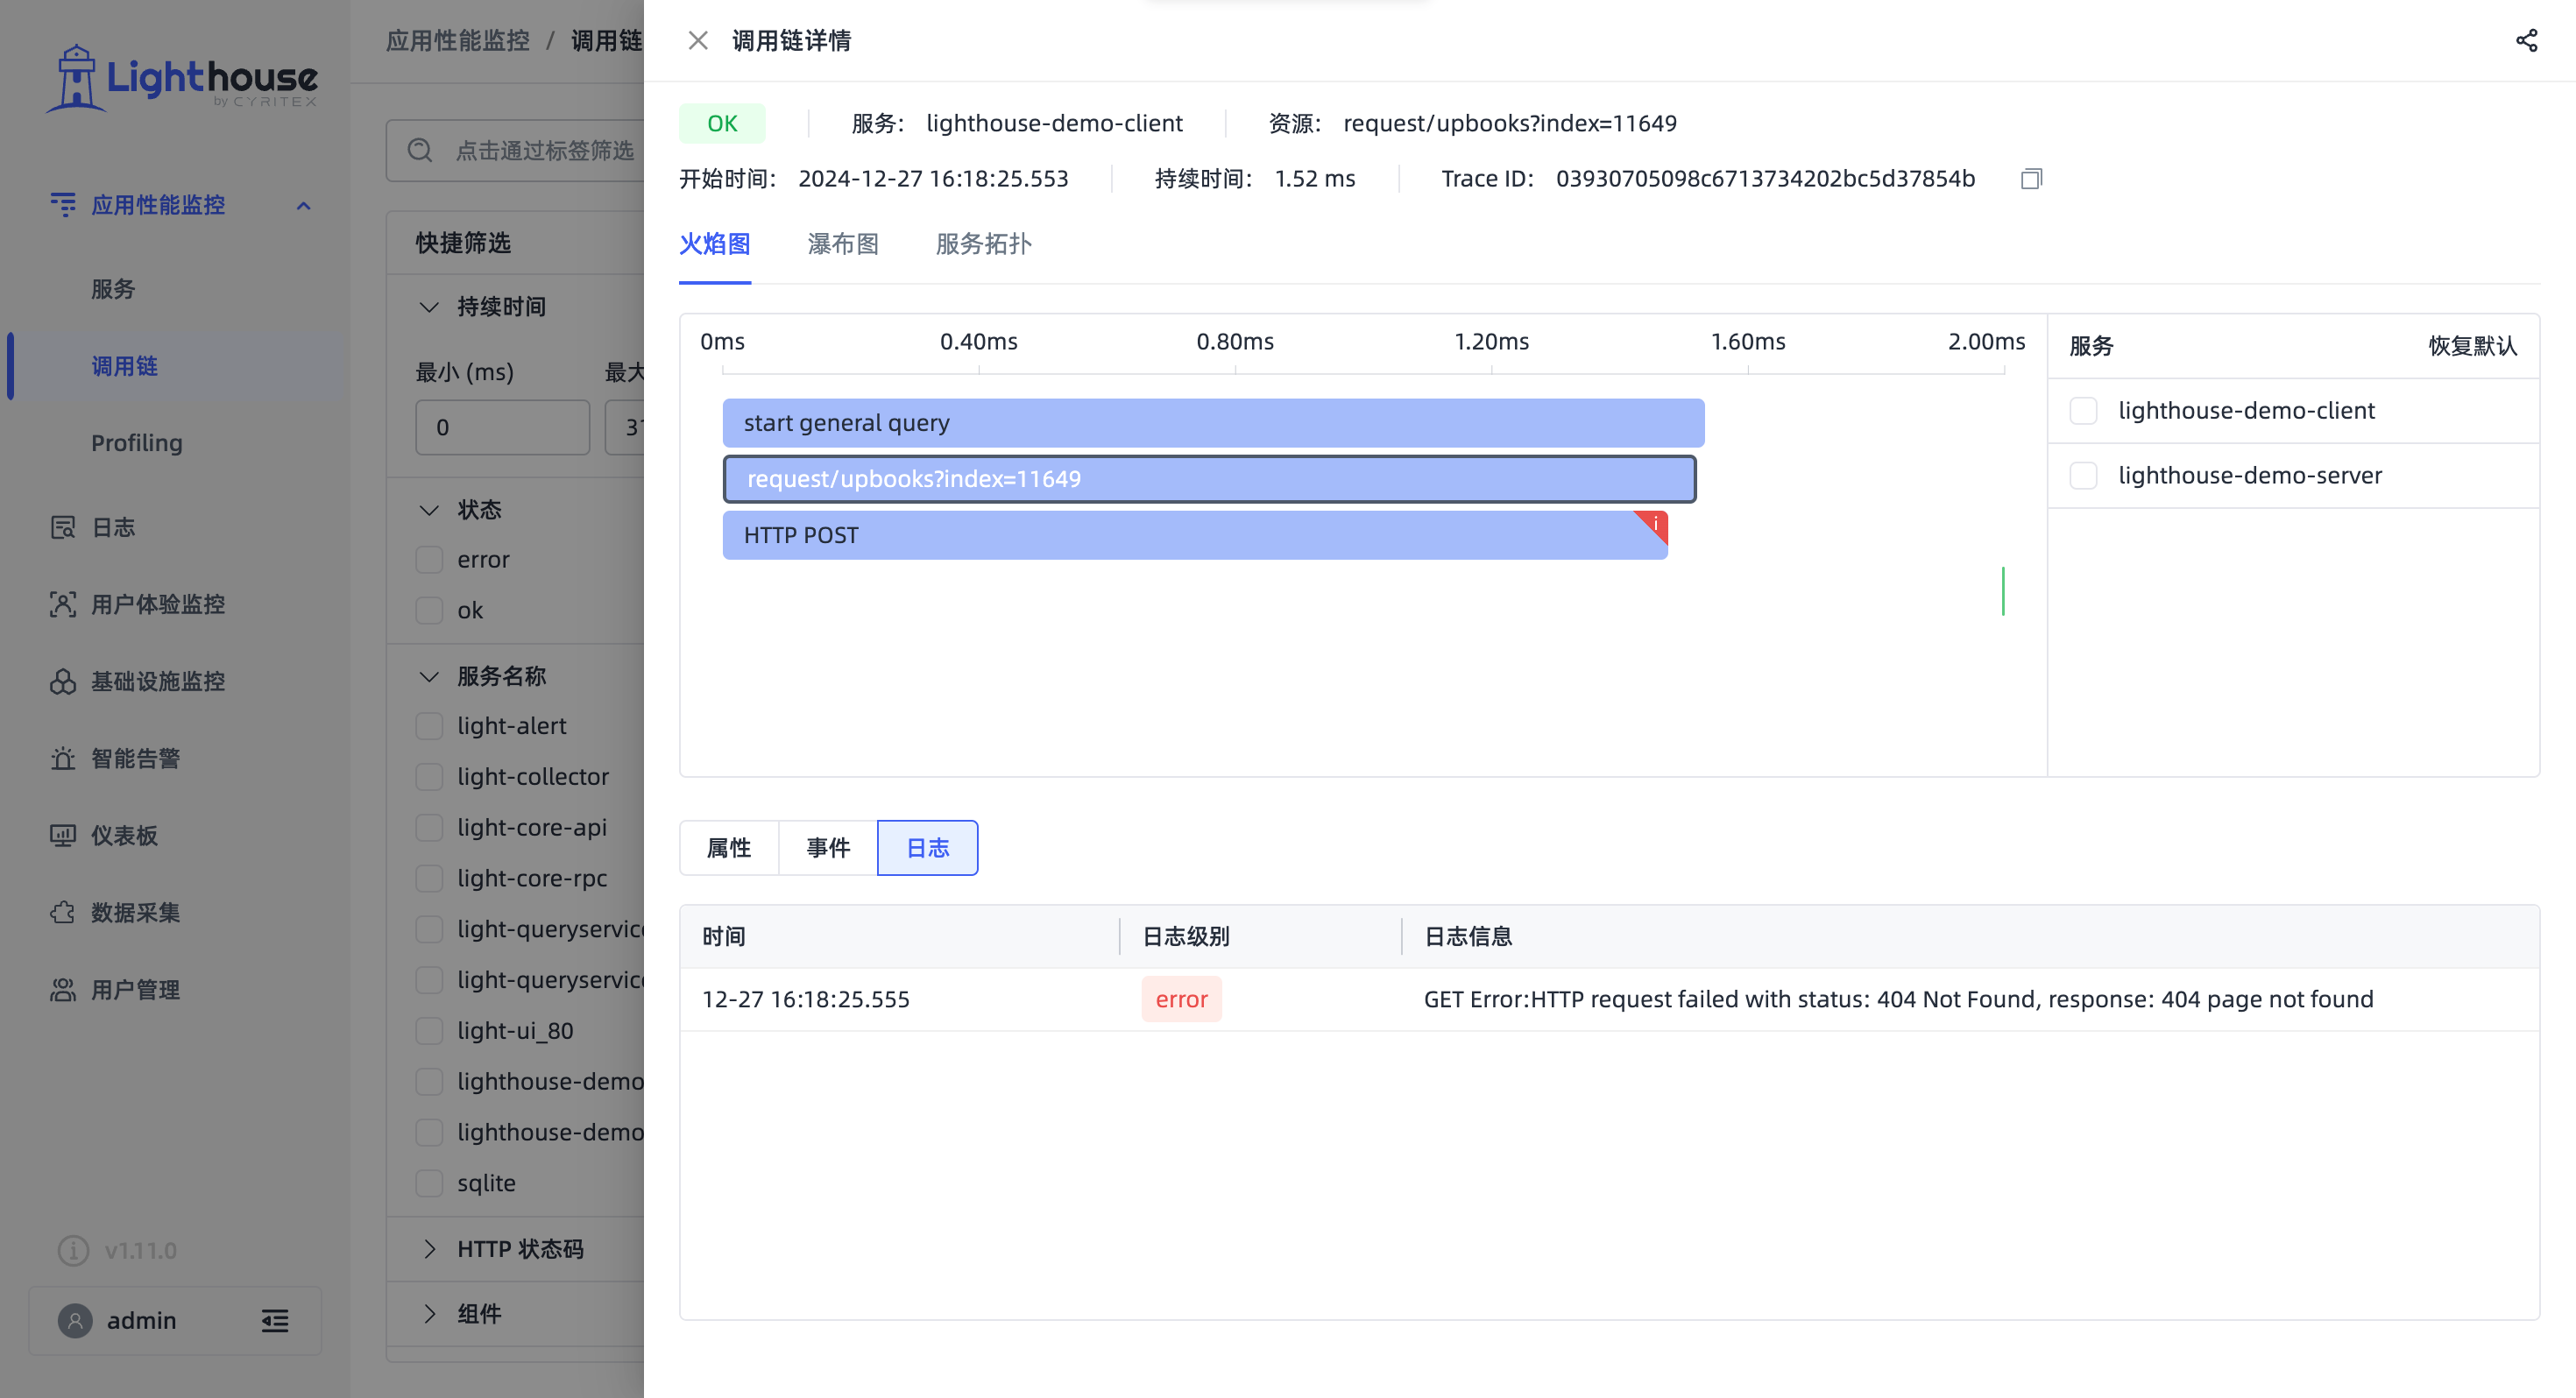
  2. Added associated log list display in trace detail page.
imgimg